Written:
May 6, 2025
A step by step breakdown of a tokenomics audit covering allocation distribution, vesting, inflation, investor terms, valuation, liquidity, and value flow.

This document is designed to show clarity on our systematic process to auditing tokenomics frameworks and our structured audit methodology, detailing the six key verticals we focus on:
⓵ - Distribution Fairness
⓶ - Economic and Monetary Policies
⓷ - Investor Conditions
⓸ - Valuation and Performance
⓹ - Listing & Liquidity
⓺ - Utility & Value Flow
A truly end-to-end tokenomics audit

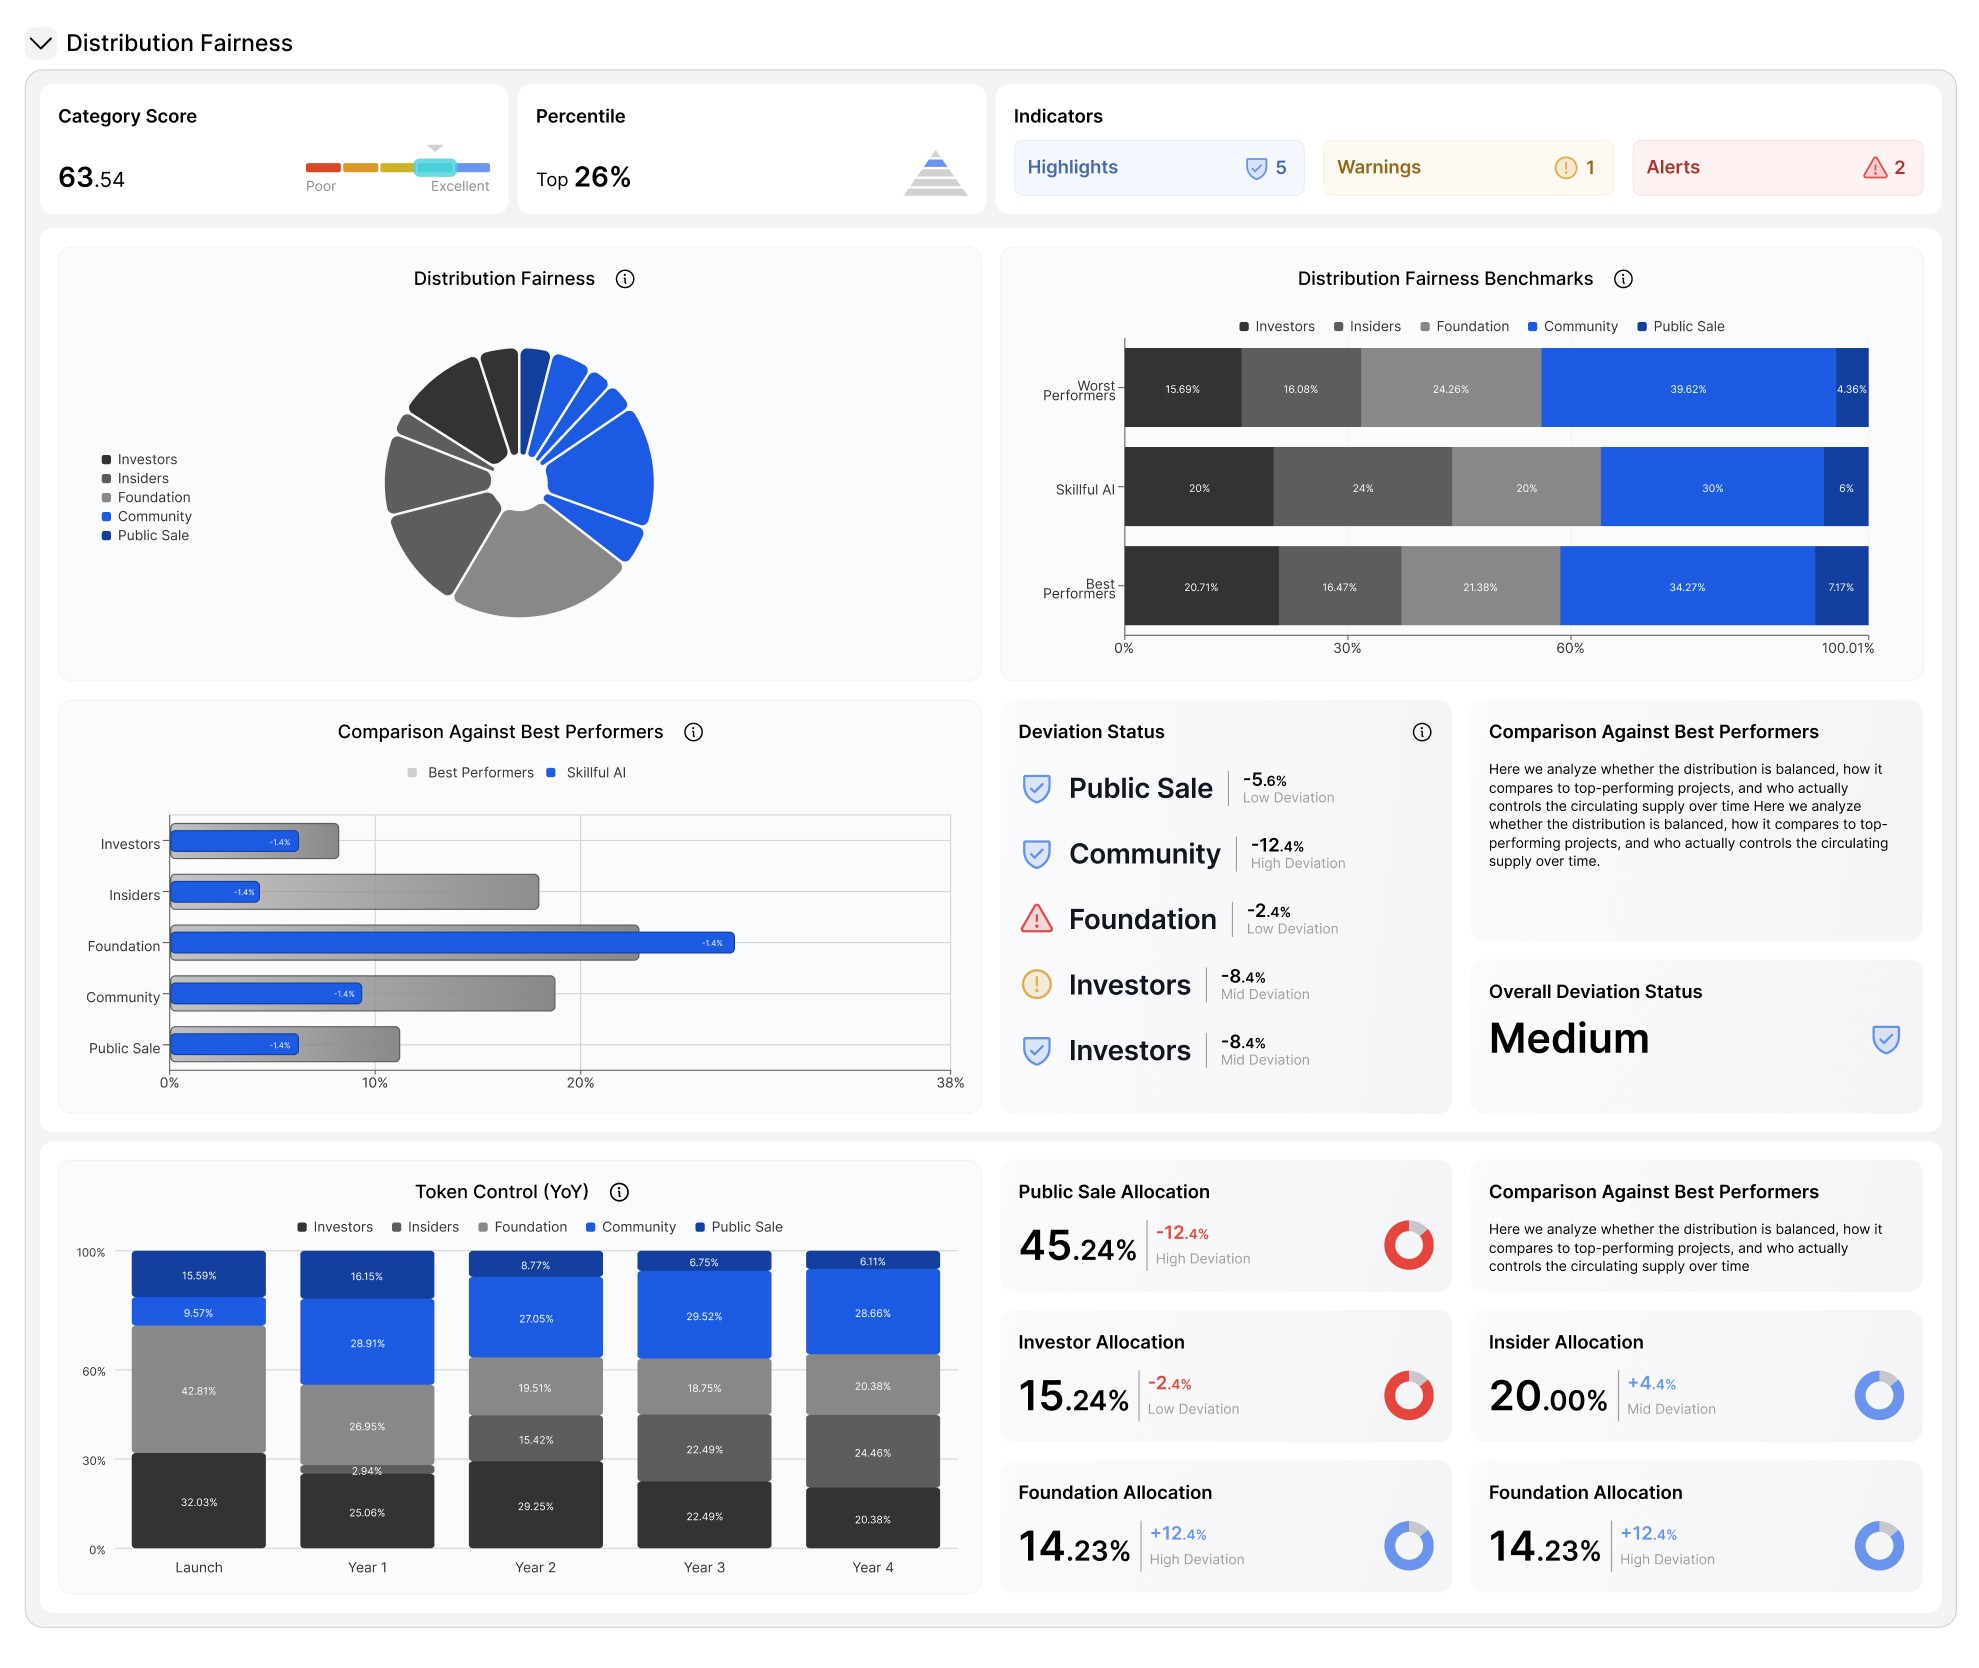
⓵ - Distribution Fairness
This section focuses on how tokens are allocated across different stakeholder groups.
We analyze whether the distribution is balanced, how it compares to top-performing projects, and who actually controls the circulating supply over time (critical for governance purposes), especially in the early stages when it matters most.
⓶ - Economic and Monetary Policies
This vertical breaks down the mechanics behind token issuance, how supply enters the market, and how it dilutes existing holders over time. We focus on four main areas: inflation, supply shocks, float, and dilution risk.

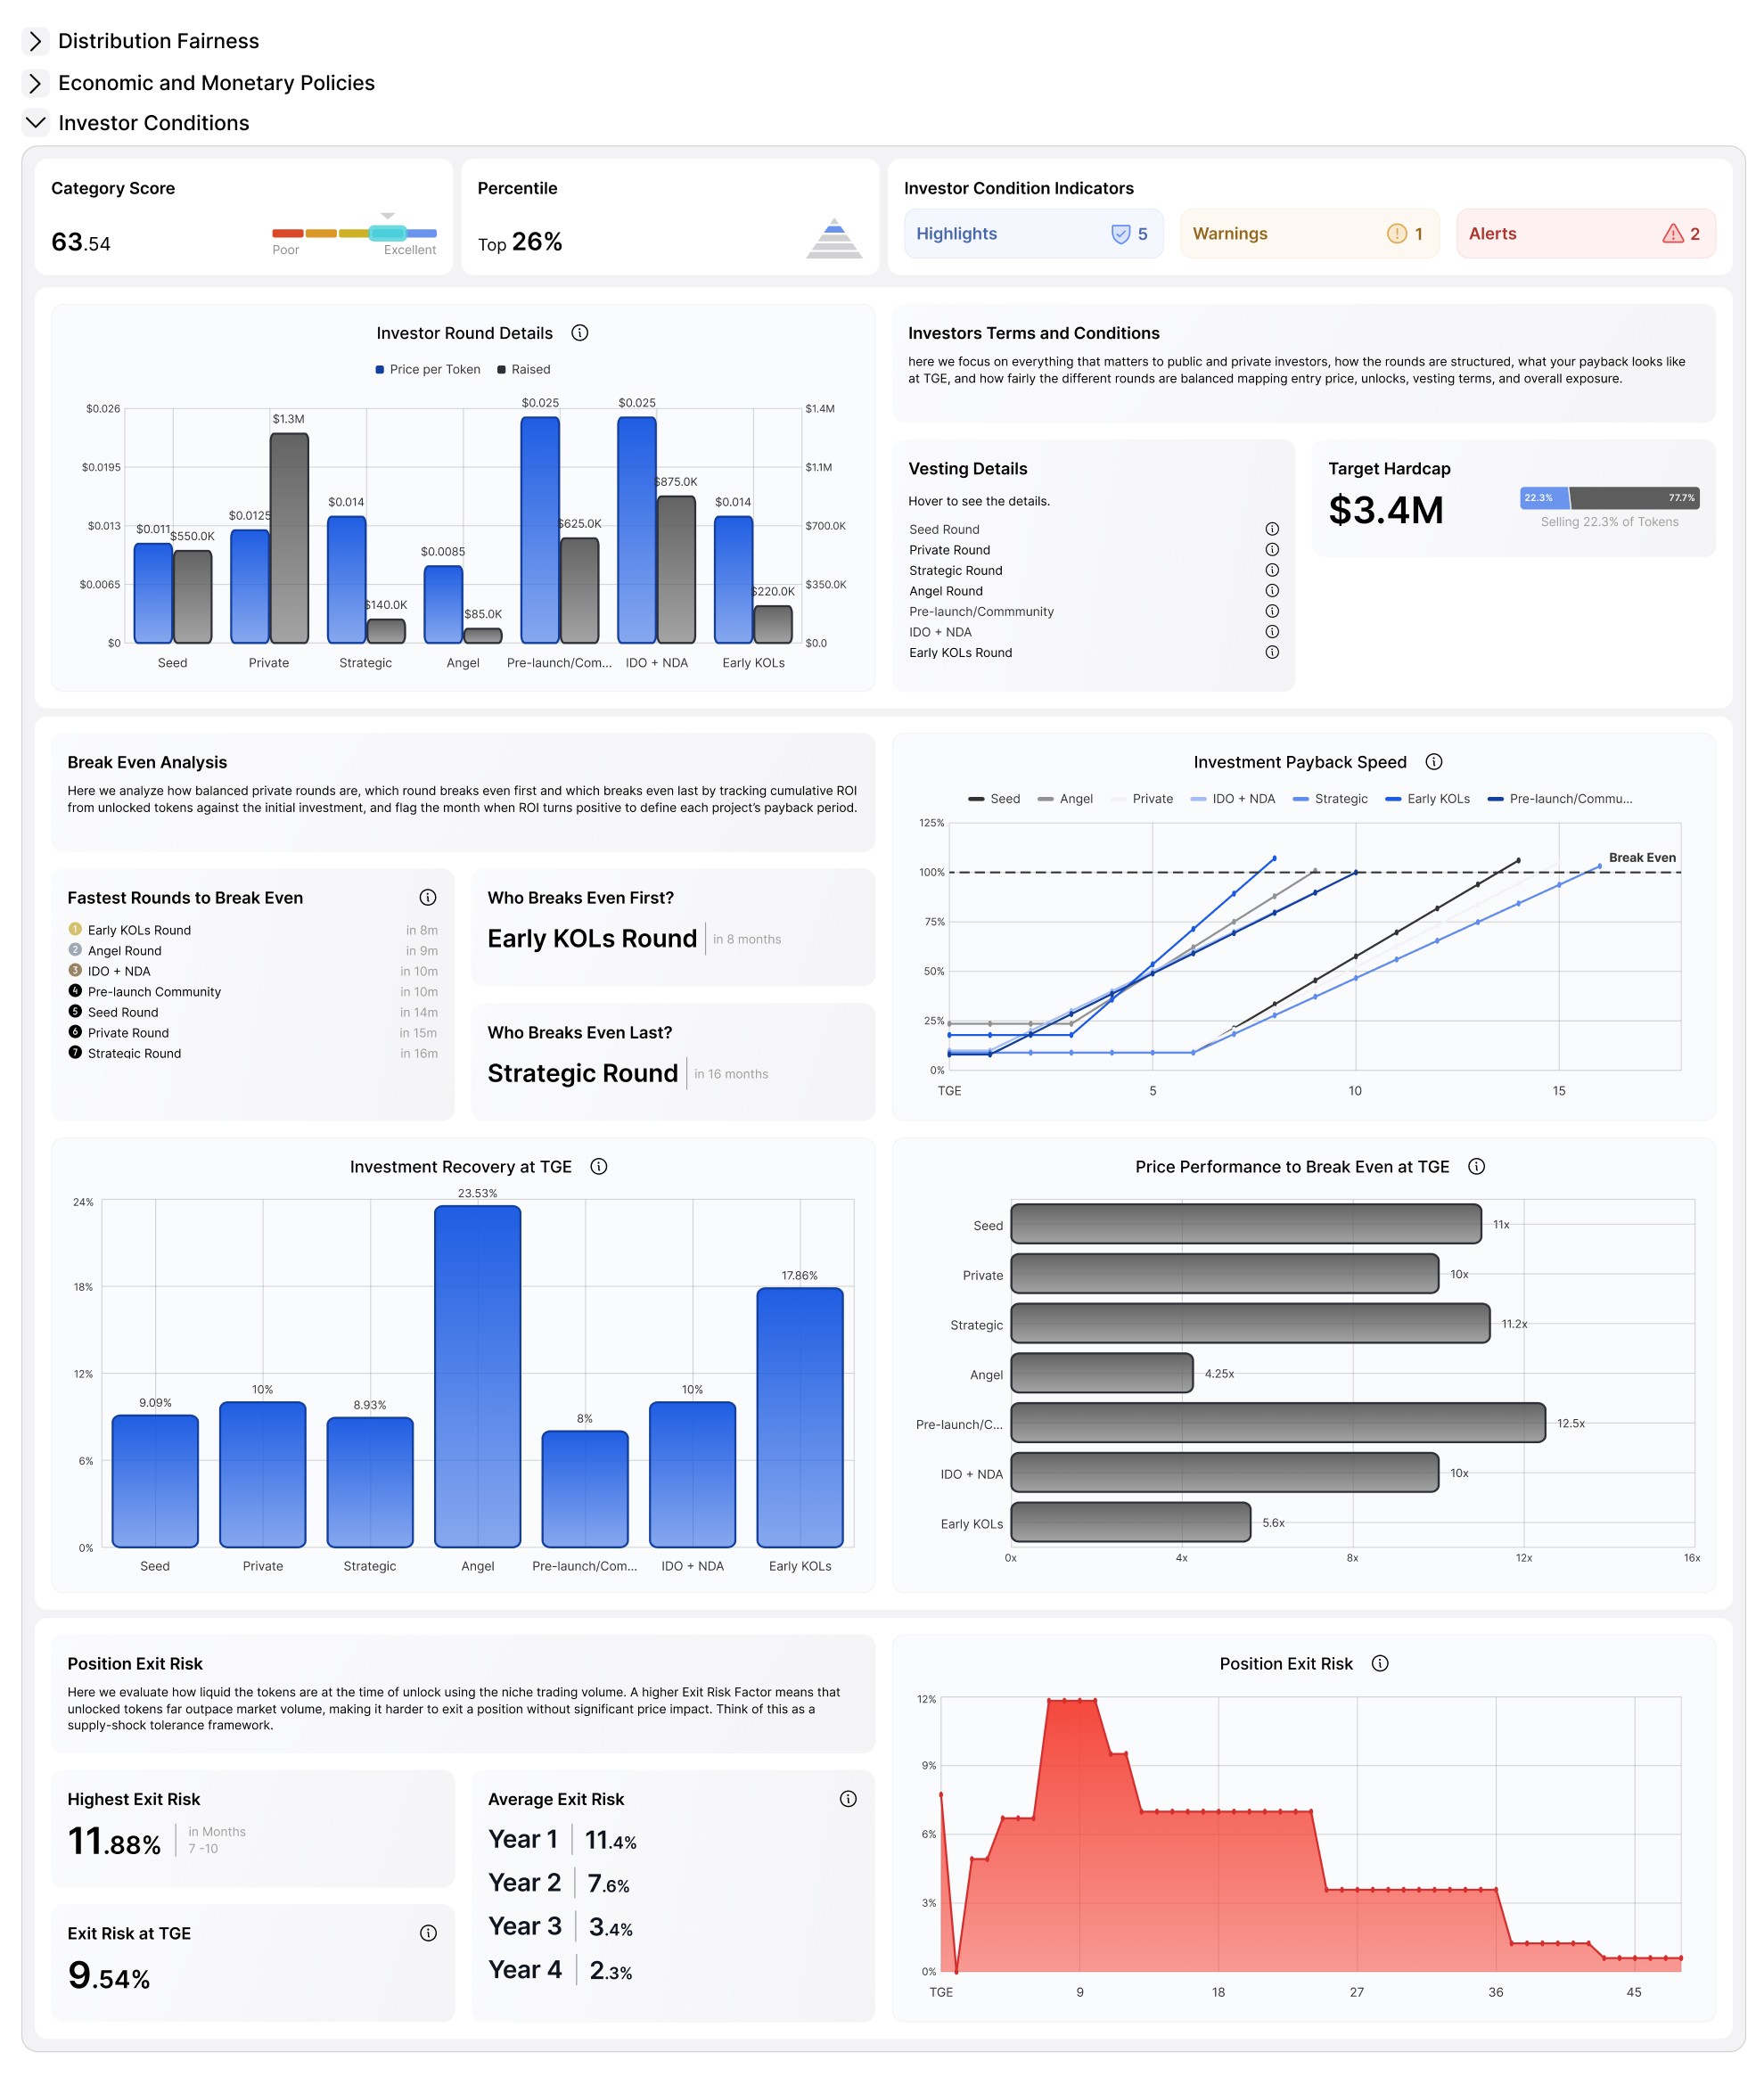
⓷ - Investor Conditions
In this vertical, we focus on everything that matters to public sale and private investors how the rounds are structured, what your payback looks like at TGE, how fairly the different rounds are balanced and the position exit risk.
We analyze each investor round in detail, mapping entry price, unlocks, vesting terms, and overall exposure. From that, we calculate which round offers the best terms, which one carries the most risk, and whether there’s any structural conflict between rounds.
⓸ - Valuation and Performance
In this vertical, we make sure the project is not priced out of the market.
We first compare its FDV against the top five competitors, the last 15 launches, and all the launches in the past year (of the niche, like RWA).
On top of that, we include our Vesting Diluted Valuation Model, which calculates the market cap needed at each unlock event for investors to break even.
And finally we are able to point which is the best valued round for private investors (by both valuation models), whats the performance of the niche, and if the project is overvalued or undervalued in terms of relative comparison to the niche, and current state of the market.

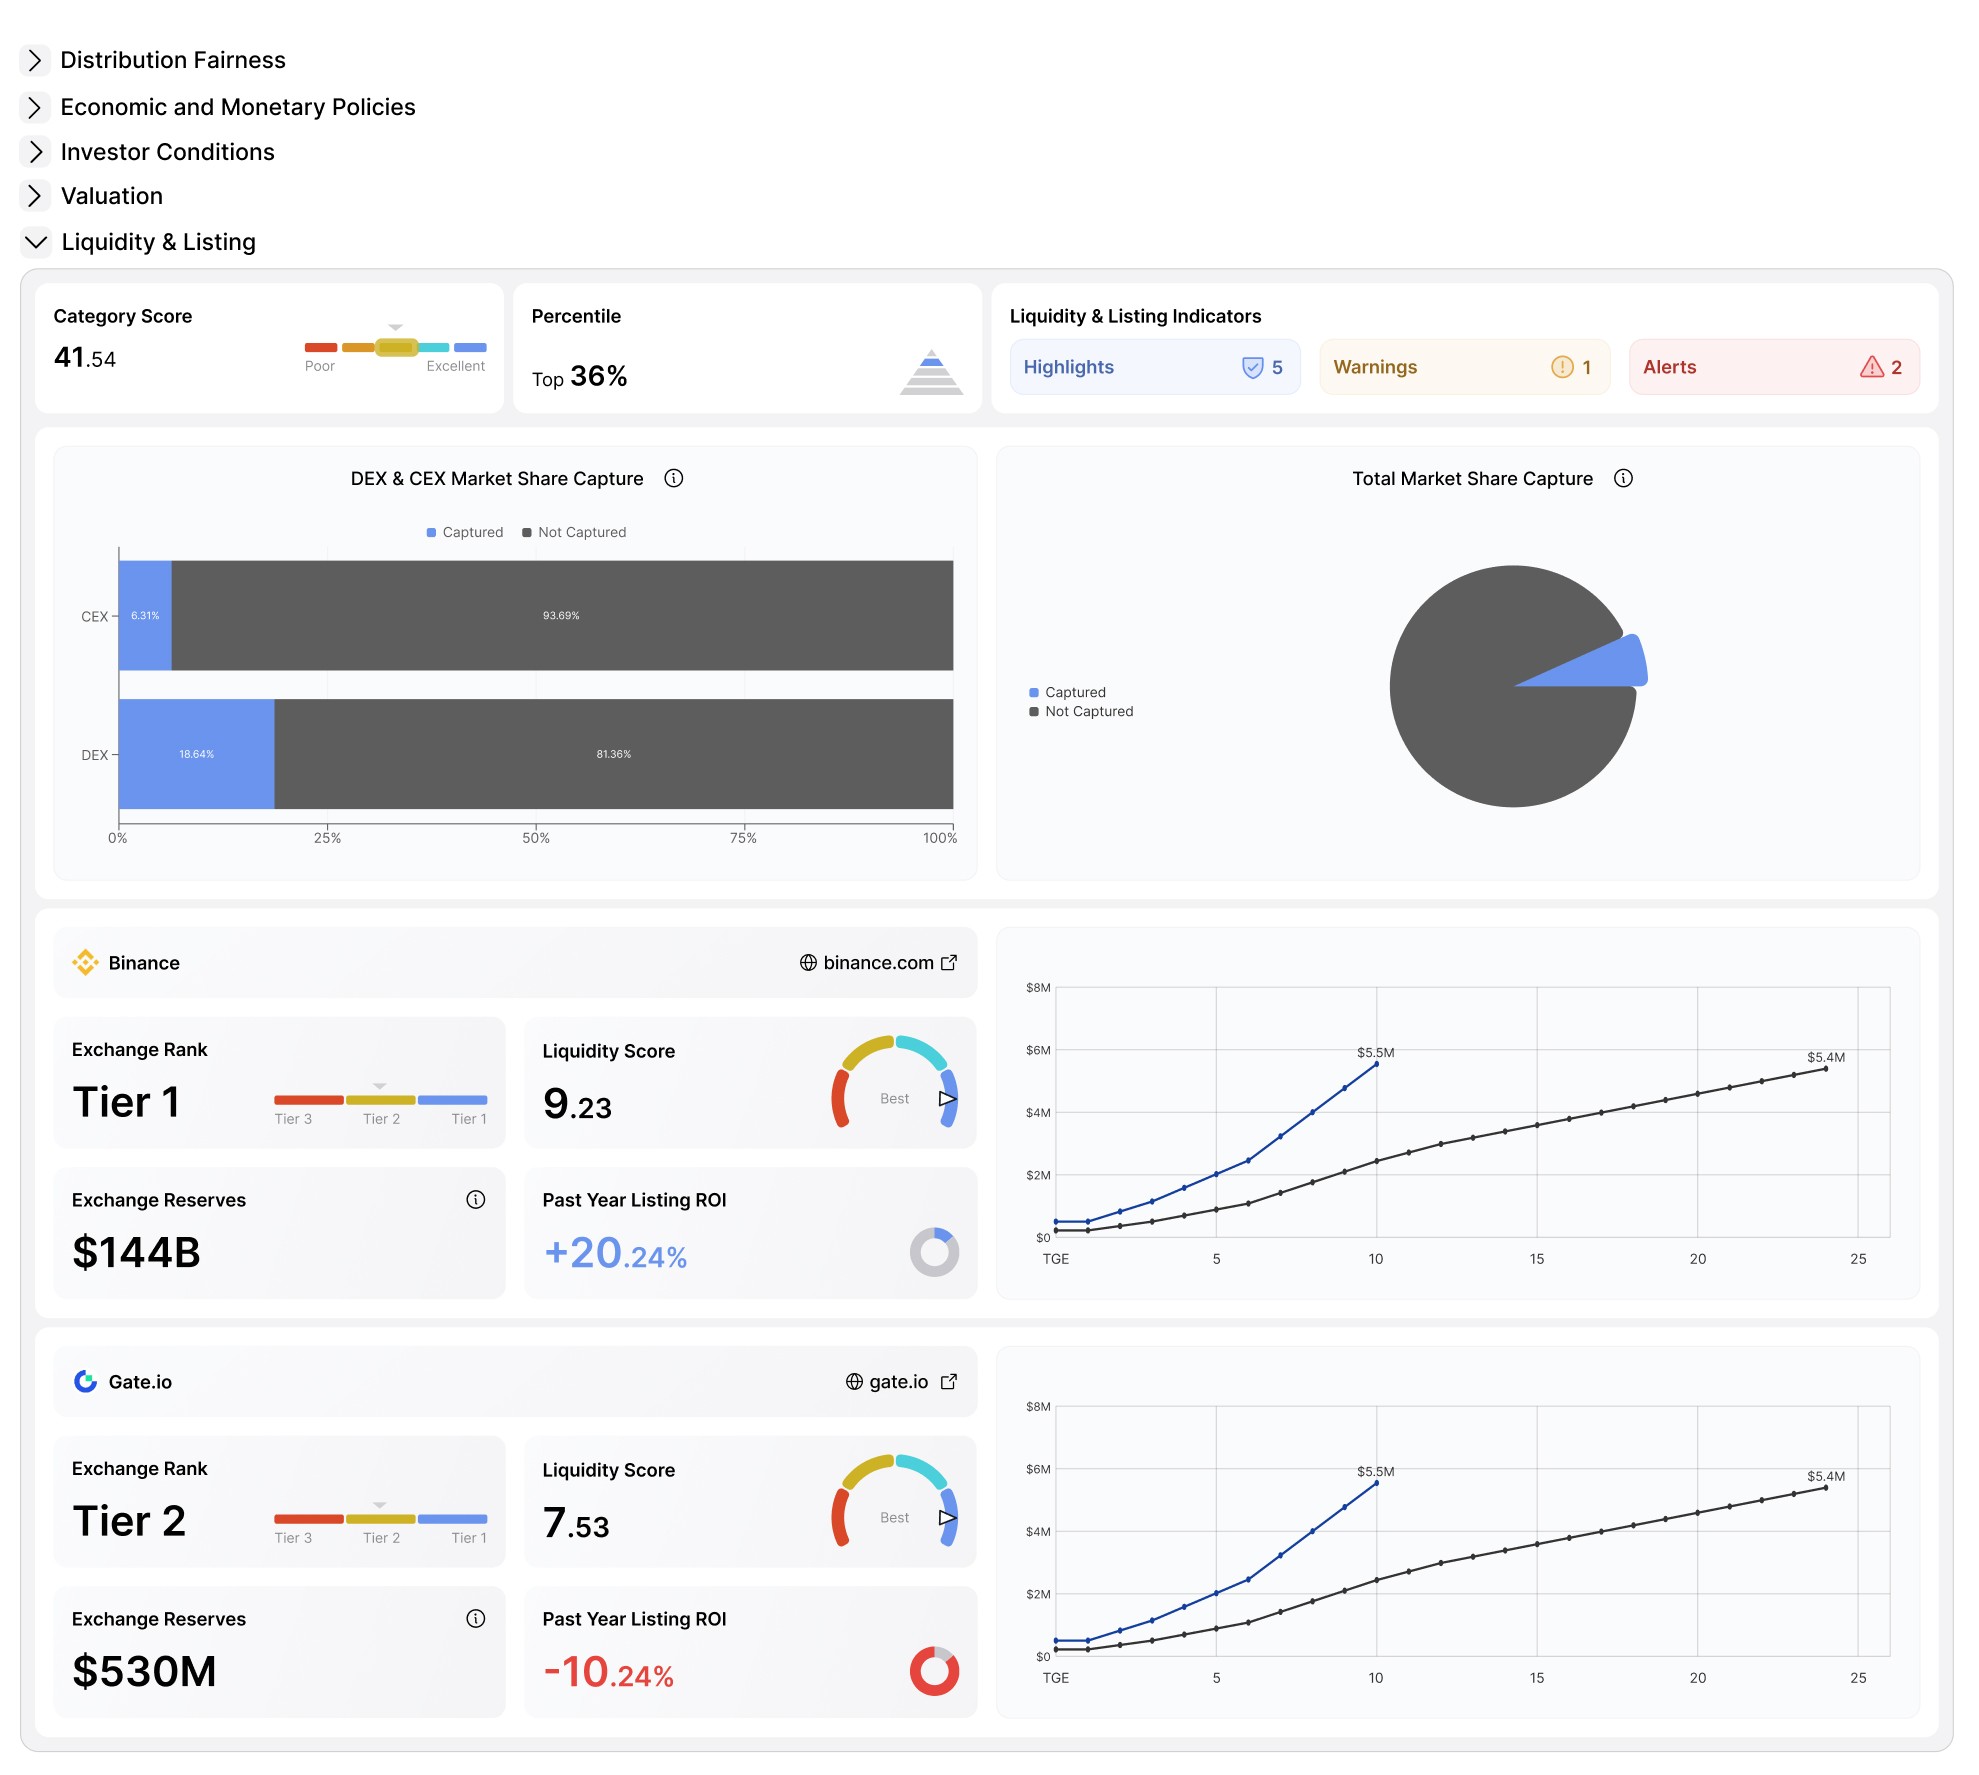
⓹ - Listing & Liquidity
We analyze how strong the listing strategy is, and whether it supports the tokenomics design. How much market share they are capturing (both CEXs and DEXs), which exchanges they are listing on, and how those exchanges have performed over the past year.
Everything we’ve covered in this audit so far: distribution fairness, monetary policy, investor terms, valuation, and historical performance is critical to understanding a token’s economic structure.
But structure alone is not enough.
Even a perfectly timed vesting schedule or a fairly priced listing can collapse if there’s no actual demand for the token, or if that demand isn’t directed in a way that retains value inside the ecosystem.
⓺ - Utility & Value Flow
This vertical examines whether the token has a reason to exist — and more importantly, a reason to be held.
We apply first-principles reasoning:
What value does the system design create?
Where does that value go?
And how does the token participate in that flow?
We map three core layers of the token economy:
Value Creation: Is the protocol producing anything of economic or social value (transactions, compute, liquidity, data)?
Value Capture: Does the system retain part of that value inside the network/company/foundation, instead of letting it leak to external actors or intermediaries?
Value Accrual: Does the token itself absorb that captured value, through mechanisms like buybacks, burn, or fee redistribution?

FAQs
Tokenomics Audit FAQ
1. What is a tokenomics audit and how does your methodology work
A tokenomics audit is a structured review of a project’s digital asset economy to test sustainability and compliance. Our methodology covers six verticals: Distribution Fairness, Economic and Monetary Policies, Investor Conditions, Valuation and Performance, Listing and Liquidity, and Utility and Value Flow. We reconcile documentation, smart contract parameters, and market data so model, disclosure, and behavior align.
2. How do you evaluate distribution fairness and control of circulating supply
We map allocations by group, unlock timelines, and real control over early float. We score concentration and control with metrics like top holder share over time and HHI or Gini, identify governance risks, and flag sell pressure hotspots that can affect liquidity and price stability.
3. How do you assess supply, emissions, inflation, and dilution over time
We build month by month emission models with vesting, cliffs, and float trajectory. We flag supply shocks, often months above 10 percent growth, estimate holder dilution by cohort, and run scenarios for parameter changes, burns, or buybacks, producing clear tables and charts for listings and disclosures.
4. How do you review investor conditions and TGE payback risk
We analyze each round’s entry price, unlocks, vesting, and protections to compute TGE payback, break even paths, and exit risk. The output ranks rounds by fairness and risk, surfaces structural conflicts between rounds, and suggests term adjustments that reduce future sell pressure.
5. How do you benchmark valuation, listing, and liquidity readiness and what do clients receive
We compare FDV to top competitors, the last 15 launches, and the past year of the niche, then apply a vesting diluted valuation model that shows the market cap needed to break even at each unlock. We review exchange mix, depth, spreads, and market maker terms to rate listing readiness. Deliverables include a written audit with prioritized fixes, emission and vesting tables, supply and dilution charts, a valuation and liquidity rubric, and integration ready copy for whitepapers and exchange submissions.
About the Author
Founder of Tokenomics.com
With over 750 tokenomics models audited and a dataset of 2,500+ projects, we’ve developed the most structured and data-backed framework for tokenomics analysis in the industry.
Previously managing partner at a web3 venture fund (exit in 2021).
Since then, I’ve personally advised 80+ projects across DeFi, DePIN, RWA, and infrastructure.
