Written:
Feb 1, 2026
The promise of crypto dividends has attracted investors for years, but which tokens actually deliver? Unlike traditional governance tokens that offer...

The promise of crypto dividends has attracted investors for years, but which tokens actually deliver? Unlike traditional governance tokens that offer voting rights alone, revenue-sharing crypto tokens distribute a portion of protocol earnings directly to holders through staking rewards, fee sharing, or token buybacks.
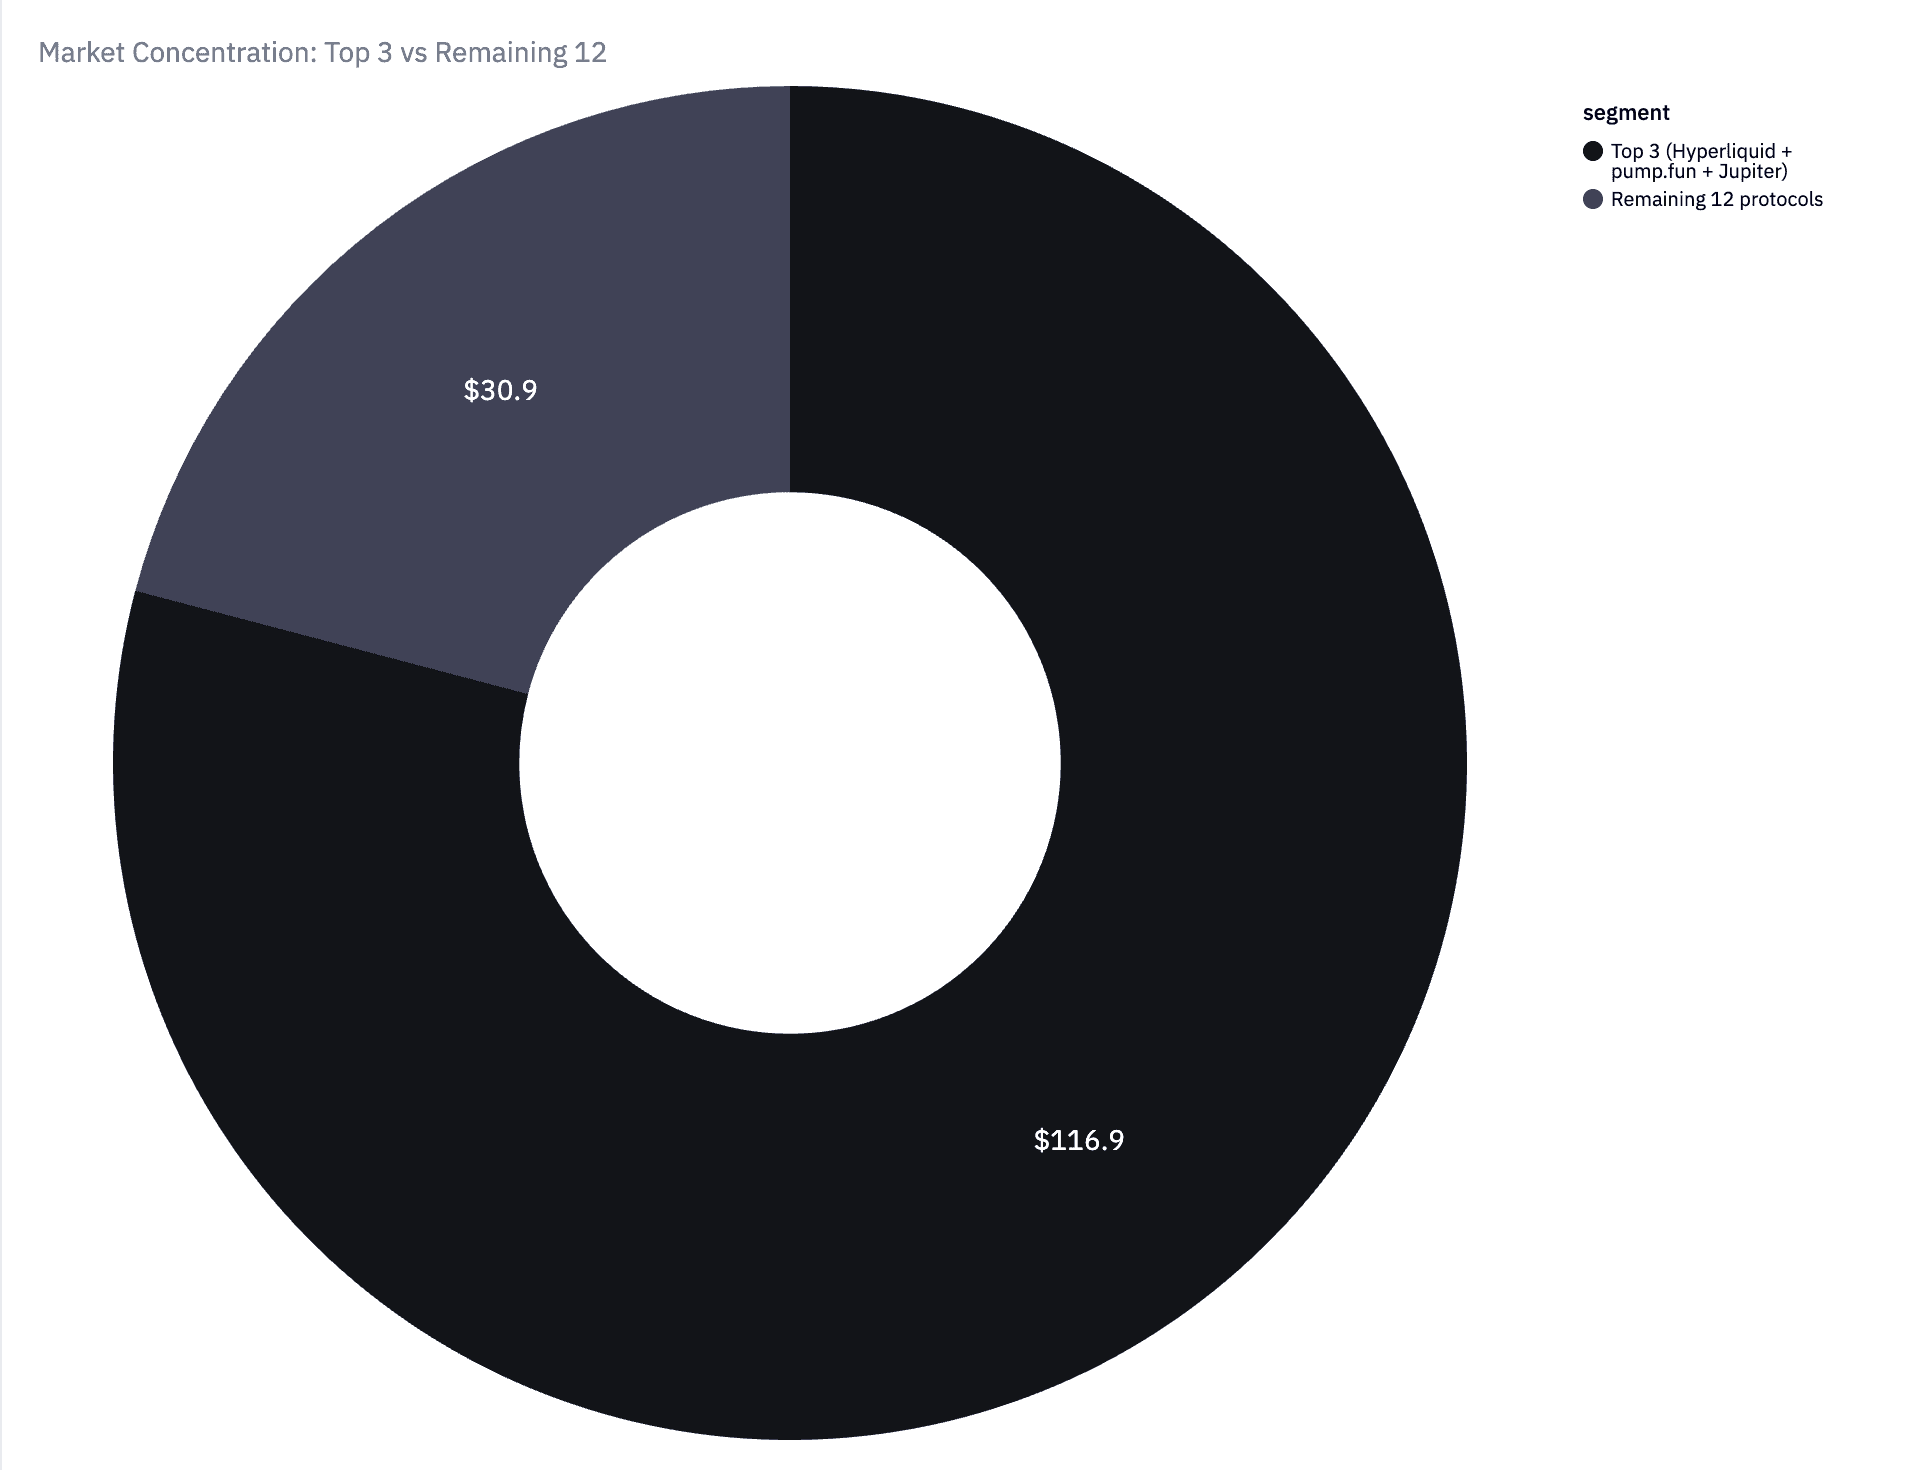
Industry data reveals that the top 15 revenue-sharing protocols distributed $147.8 million to token holders in the last 30 days, with Hyperliquid leading the pack at $62.6M monthly. This represents real cash flows, not inflationary staking rewards or temporary liquidity mining incentives. Understanding how these mechanisms work and which protocols generate sustainable holder revenue helps investors identify genuine dividend-paying crypto assets.
This guide ranks the top revenue-sharing tokens by actual holder earnings using DeFiLlama data, explains how different distribution mechanisms function, and provides criteria for evaluating sustainable crypto dividends.
What Are Crypto Dividends?
Crypto dividends refer to regular distributions of value to token holders derived from a protocol's revenue. Unlike staking rewards that come from newly minted tokens, crypto dividends originate from actual economic activity like trading fees, lending interest, or protocol revenue.
Holder revenue represents the subset of protocol fees that flows back to token holders through mechanisms like direct distributions, buyback and burn programs, or staking rewards funded by fees. DeFiLlama tracks this metric separately from total protocol revenue to show exactly how much value returns to investors.
The distinction matters because many tokens offer "staking rewards" funded purely by inflation. These emissions dilute existing holders and don't represent real dividends. True revenue-sharing crypto distributes a percentage of fees earned from users, creating alignment between protocol growth and token holder returns.
Three primary mechanisms distribute holder revenue:
Direct fee sharing sends a percentage of protocol fees to token holders, typically through staking. Aerodrome distributes 100% of trading fees to veAERO voters weekly, while GMX allocates 27% of perpetual trading fees to staked GMX holders in ETH and AVAX.
Buyback and burn uses protocol revenue to purchase tokens from the market and permanently remove them from circulation. Hyperliquid channels 97% of trading fees into HYPE buybacks, reducing supply and creating price support. This mechanism provides value without triggering taxable events for holders.
Fee burns directly destroy a portion of fees paid in the native token, reducing circulating supply. Unlike buybacks that create market demand, burns simply remove tokens from existence. Both mechanisms make remaining tokens scarcer.
How We Measure
We distinguish between three levels of protocol earnings, each revealing different insights about tokenomics.
Total fees represent all user payments to a protocol including amounts paid to liquidity providers, validators, or other network participants. For a DEX, this includes both trading fees and liquidity provider earnings. Total fees measure protocol usage but don't indicate how much value the protocol captures.
Protocol revenue is the subset of fees the protocol keeps for itself after paying network participants. This amount typically funds the treasury, development team, or token holder distributions. Protocol revenue shows the protocol's actual business income before deciding how to allocate it.
Holder revenue represents the portion of protocol revenue distributed back to token holders through staking rewards, buybacks, burns, or direct payments. This metric most directly measures token holder returns and helps identify genuine dividend-paying crypto.
The relationship between these metrics reveals tokenomics efficiency. A protocol generating $10M in total fees might keep $2M as protocol revenue and distribute $1M as holder revenue. The 10% holder revenue rate shows what percentage of user fees ultimately flows to investors.
Industry data aggregation platforms track these metrics by parsing on-chain transactions, monitoring treasury movements, and analyzing smart contract distribution mechanisms. The methodology provides standardized comparisons across different protocols and revenue models.
Top Revenue-Sharing Tokens: Ranked by Holder Revenue
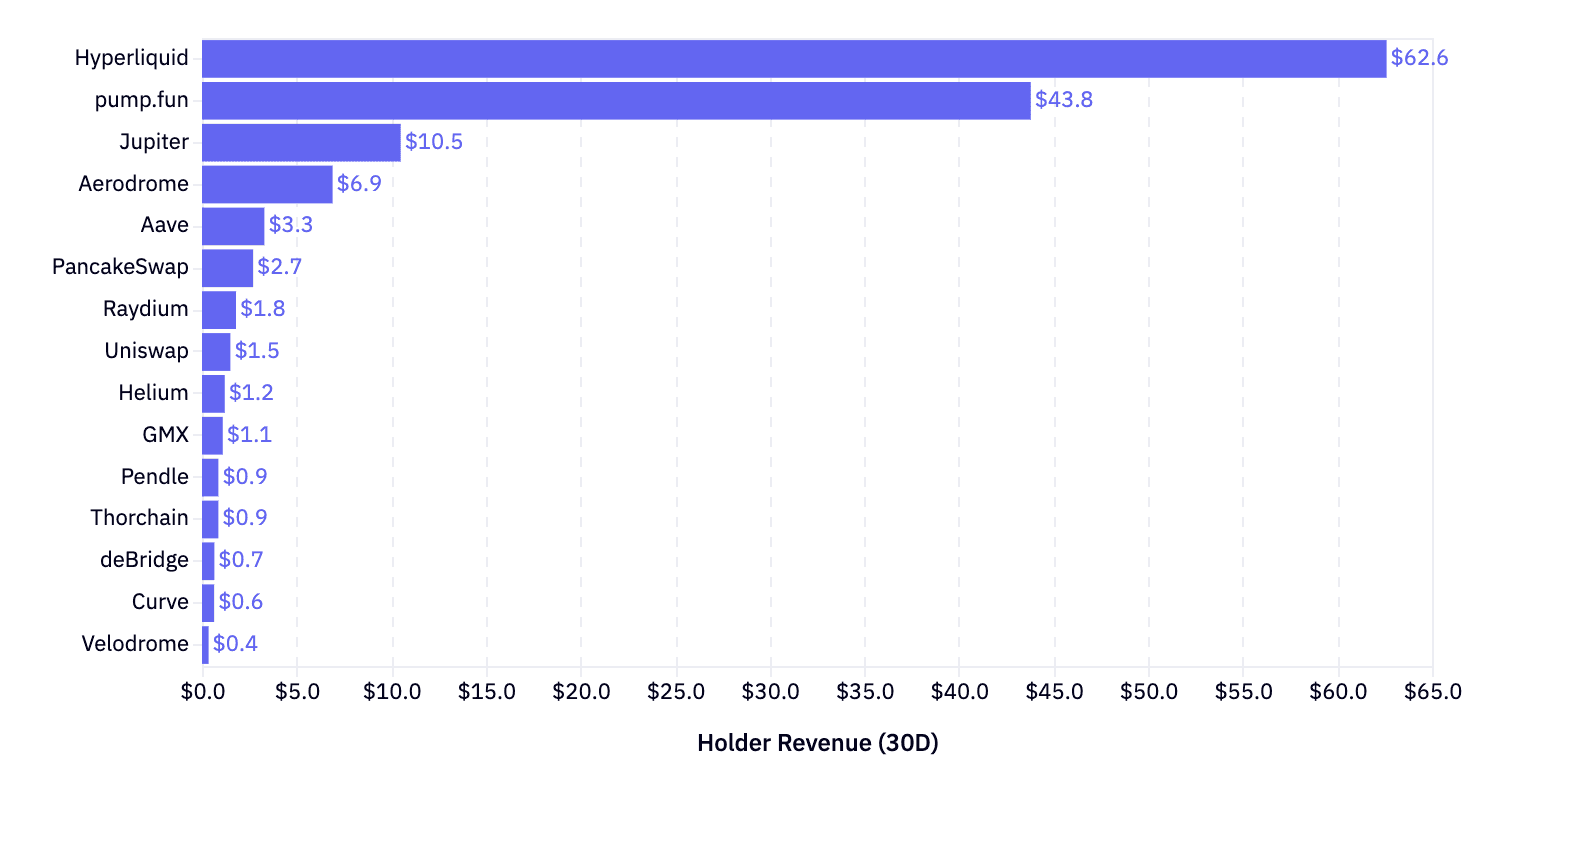
The following ranking uses 30-day holder revenue data to identify which crypto tokens pay the highest dividends to investors. These figures represent actual distributions, not potential or annualized projections.
Rank | Protocol | Token | 30-Day Holder Revenue | % of Fees to Holders | Mechanism |
1 | Hyperliquid | HYPE | $62.6M | 90.9% | Buyback & Burn |
2 | pump.fun | PUMP | $43.8M | N/A | Direct Distribution |
3 | Jupiter | JUP | $10.5M | N/A | Fee Sharing |
4 | Aerodrome | AERO | $6.9M | 100% | veToken Fee Sharing |
5 | Aave | AAVE | $3.3M | 5.5% | Staking Rewards |
6 | PancakeSwap | CAKE | $2.7M | N/A | Fee Sharing |
7 | Raydium | RAY | $1.8M | N/A | Fee Sharing |
8 | Uniswap | UNI | $1.5M | 4.1% | Fee Switch (New) |
9 | Helium | HNT | $1.2M | 100% | Staking Rewards |
10 | GMX | GMX | $1.1M | 27% | Fee Sharing |
11 | Pendle | PENDLE | $868K | 79% | vePENDLE Rewards |
12 | Thorchain | RUNE | $864K | N/A | Node Rewards |
13 | deBridge | DBR | $652K | 96% | Staking Rewards |
14 | Curve | CRV | $642K | N/A | Fee Sharing |
15 | Velodrome | VELO | $350K | 100% | veToken Fee Sharing |
Data methodology: Holder revenue figures from DeFiLlama protocol metrics tracking 30-day distributions. Percentages represent the portion of total protocol fees distributed to token holders through staking, buybacks, or direct payments.
The wide range of distribution percentages reveals different strategic choices. Aerodrome, Velodrome, dYdX, and Helium distribute 100% of fees to token holders, prioritizing immediate holder value over treasury accumulation. Hyperliquid channels 90.9% into buybacks, balancing holder returns with protocol reserves.
Conversely, Aave (5.5%) and Uniswap (4.1%) retain most revenue for protocol development and DAO treasuries while recently activating token holder distributions. These lower percentages don't necessarily indicate worse tokenomics - they reflect different growth strategies and governance philosophies.
Absolute dollar amounts matter more than percentages for investor returns. Hyperliquid's $62.6M in monthly holder revenue at 90.9% of fees exceeds Aerodrome's $6.9M despite Aerodrome distributing 100% of fees. Trading volume and total fees drive actual distributions.
Revenue Distribution by Protocol Category
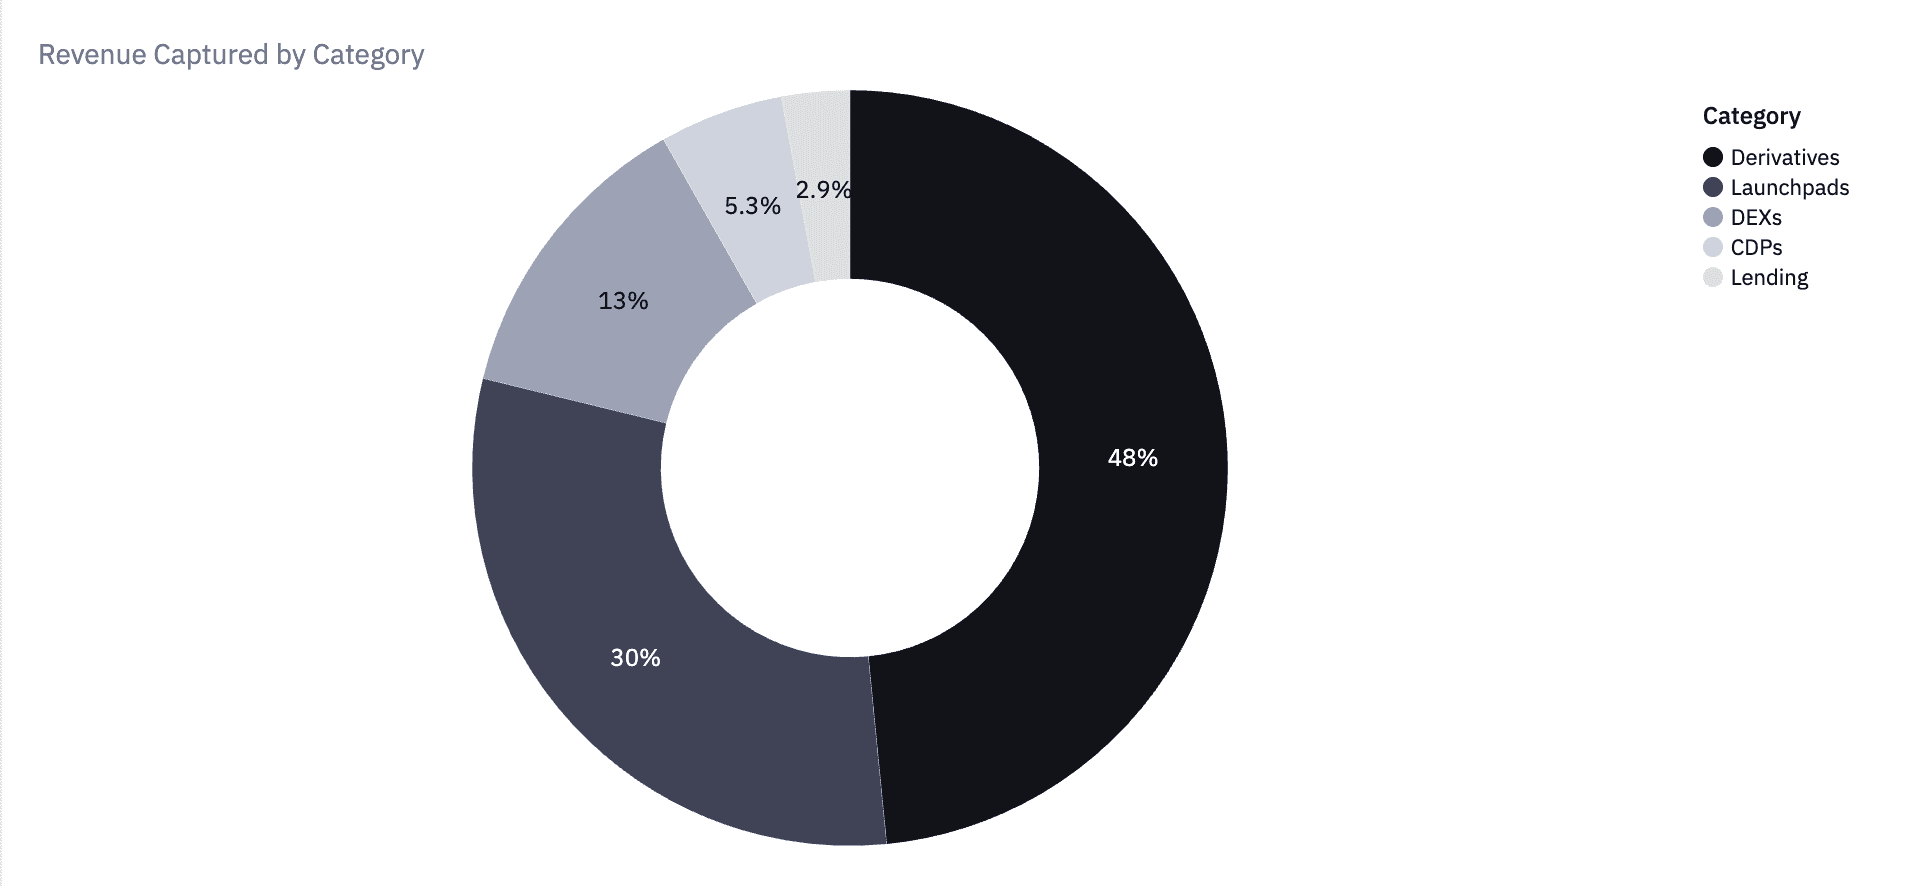
Different DeFi sectors generate varying levels of holder revenue based on fee structures, competitive dynamics, and tokenomics design. The 30-day holder revenue by category reveals which protocol types best align token holder interests with business outcomes.
Derivatives platforms lead holder revenue generation with $76.6M across 19 protocols in the last 30 days. Perpetual trading platforms charge higher fees than spot markets due to leverage and funding rates. Hyperliquid alone accounts for $62.6M of derivatives holder revenue, demonstrating how a single high-volume platform dominates this category.
Launchpads generated $48M in holder revenue across 8 protocols, driven primarily by pump.fun's $43.8M contribution. Meme token launch platforms capture significant value during periods of retail speculation and distribute most fees to token holders rather than building large treasuries.
Decentralized exchanges distributed $20.5M across 87 protocols, showing fragmentation across many platforms. The category includes both AMM-based DEXs like Uniswap and Aerodrome and order book exchanges. Competition pressures many DEXs to share fees with liquidity providers and token holders to maintain market share.
Collateralized debt positions (CDPs) like MakerDAO and Liquity generated $8.4M across 11 protocols. These platforms earn stability fees and interest on loans, with sustainable but lower volumes than trading-focused platforms.
Lending protocols produced $4.6M in holder revenue across 11 platforms, led by Aave's $3.3M. Lending platforms typically retain most interest spreads for protocol reserves and liquidity backstops, resulting in lower holder revenue percentages despite significant total fees.
Category totals show that trading-focused protocols generate the highest holder revenue due to high transaction volumes and fee capture. Lending and CDP platforms build substantial protocol reserves before distributing to holders, reflecting risk management priorities.
How Revenue-Sharing Mechanisms Work
Revenue-sharing tokens employ different distribution mechanisms based on regulatory considerations, tax implications, and governance philosophy. Understanding these approaches helps evaluate which structures align with investment goals.
Direct Fee Sharing
Direct fee sharing distributes a percentage of protocol revenue to token holders through staking or vote-escrowed positions. This mechanism most closely resembles traditional stock dividends.
Aerodrome's model exemplifies comprehensive fee sharing. Users lock AERO tokens for up to 4 years to receive veAERO NFTs granting voting rights on liquidity pool emissions. Each week, veAERO voters receive 100% of trading fees from the previous epoch plus any additional incentives. Lock duration determines voting power - 100 AERO locked for 1 year yields 25 veAERO, while a 4-year lock provides maximum voting influence.
GMX distributes 27% of perpetual trading fees to staked GMX holders in ETH on Ethereum and AVAX on Avalanche. These distributions occur continuously as trades execute, providing real-time fee sharing. The remaining fees fund GLP liquidity provider rewards and protocol reserves.
Pendle allocates 79% of revenue to vePENDLE holders who lock PENDLE tokens. The protocol's yield trading model generates fees from both swaps and maturity positions, creating diverse revenue streams that flow to long-term stakers.
Direct fee sharing creates immediate taxable events in most jurisdictions when distributions occur. This tax treatment differs from buybacks and burns, influencing investor preferences based on tax situations.
Buyback and Burn
Buyback and burn mechanisms use protocol revenue to purchase tokens from secondary markets and permanently remove them from circulation. This approach reduces supply without creating taxable distributions.
Hyperliquid operates the largest buyback program, channeling 97% of trading fee revenue into systematic HYPE purchases. The protocol's validators execute these buybacks continuously as fees accumulate, creating constant buying pressure. Burned tokens never return to circulation, making remaining tokens scarcer.
The economic effect resembles share buybacks in traditional finance. If a protocol generates $1M monthly revenue and burns $900K worth of tokens, circulating supply decreases proportionally. Remaining holders own a larger percentage of total supply without receiving taxable income.
Token burns work best when combined with fixed or decreasing supply caps. Burning tokens from an inflationary emission schedule may only offset new issuance rather than creating net deflation. Checking emission schedules reveals whether burns reduce total supply or merely slow growth.
Market dynamics influence buyback effectiveness. Large buybacks in thin liquidity can pump prices temporarily but create selling pressure when the buying ends. Steady, predictable buybacks tend to provide more sustainable price support than sporadic large purchases.
Fee Burns
Fee burns destroy the native token paid in transaction fees rather than purchasing tokens from the market. This mechanism requires users to pay fees in the protocol's native token.
Ethereum's EIP-1559 pioneered this model, burning the base fee portion of all transactions. When network usage increases, more ETH burns occur, reducing supply. The mechanism directly links protocol usage to supply deflation.
Fee burns differ from buybacks by not creating market buying pressure. Instead, tokens simply disappear from circulation as users pay for services. This approach works well for protocols with high transaction volumes in the native token.
The deflationary effect depends on burn rate exceeding emission rate. If a protocol burns $100K daily but issues $150K in staking rewards, the net effect remains inflationary. Sustainable fee burns require fee revenue to exceed or balance ongoing emissions.
Staking Rewards
Staking rewards funded by protocol revenue differ from purely inflationary staking. Revenue-funded staking uses fee income to reward stakers rather than minting new tokens.
Helium distributes 100% of network data transfer fees to HNT stakers securing the network. As IoT devices use Helium's decentralized wireless network, they pay fees that accumulate and distribute to stakers. This creates direct alignment between network usage and staker returns.
deBridge allocates 96% of cross-chain bridge fees to DBR stakers. Bridge transaction volumes directly determine staking rewards, making APY variable based on usage rather than fixed emission schedules.
Revenue-funded staking APY fluctuates with protocol usage. High-volume periods increase distributions while quiet markets reduce returns. This variability contrasts with fixed-emission staking that maintains steady APY regardless of revenue.
Evaluating Revenue-Sharing Tokens: Key Criteria
Not all revenue-sharing tokens offer sustainable dividends. Evaluating these criteria helps identify protocols with durable holder revenue models.
Revenue Sustainability
Sustainable revenue comes from organic protocol usage rather than temporary incentives. Trading fees from genuine users, lending interest from real borrowers, and service fees from valuable utility create reliable income streams.
Red flags include revenue dependent on liquidity mining incentives or promotional campaigns. When a protocol pays higher rewards than fees generated, the revenue stream exists only while treasury funds last. Checking whether fee revenue exceeds distributed rewards reveals sustainability.
Compare 30-day holder revenue against 90-day and 180-day figures. Consistent or growing distributions indicate sustainable models. Sharp drops suggest temporary factors drove earlier revenue.
Percentage of Fees Distributed
The percentage of total fees flowing to holders reveals how much protocol value reaches investors. Higher percentages benefit current holders but may limit protocol development funding.
Protocols distributing 90-100% of fees to holders (Hyperliquid, Aerodrome, Velodrome, Helium) prioritize immediate holder returns. This approach works well for established protocols with strong product-market fit needing less development capital.
Platforms allocating 5-30% to holders (Aave, Uniswap, GMX) retain most revenue for treasuries and ecosystem development. This conservative approach builds financial reserves and funds ongoing innovation but delays holder returns.
Evaluate distribution percentages against protocol maturity and competitive position. Early-stage protocols may need treasury accumulation while mature platforms can safely distribute more to holders.
Distribution Mechanism Tax Implications
Different distribution mechanisms create varying tax obligations depending on jurisdiction. Understanding these differences helps optimize after-tax returns.
Direct fee distributions typically trigger ordinary income taxation when received. U.S. taxpayers receiving ETH or USDC distributions from GMX or Aerodrome owe taxes on the fair market value at receipt time, regardless of whether they sell.
Buyback and burn mechanisms generally don't create taxable events for holders until they sell tokens. Hyperliquid's buybacks benefit holders through price appreciation without immediate tax liability. This tax deferral provides advantages for long-term holders.
Fee burns similarly avoid taxable events by reducing supply rather than distributing assets. Holders benefit from scarcity without receiving taxable income.
Consult tax professionals for jurisdiction-specific guidance. Tax treatment varies significantly between countries and changes as regulations evolve.
Token Supply Dynamics
Holder revenue mechanisms interact with emission schedules to determine net supply changes. Analyzing total supply trends reveals whether distributions create real scarcity or simply offset inflation.
Compare holder revenue against ongoing token emissions. If a protocol burns $1M monthly but emits $2M in new tokens, the net effect remains inflationary by $1M monthly. True deflation requires burns exceeding emissions.
Check emission schedules for changes over time. Many protocols start with high emissions to bootstrap liquidity then reduce issuance as fee revenue grows. The transition from inflationary to deflationary creates supply shocks that can affect price.
Calculate net supply change percentage monthly. Protocols reducing total supply by 1-2% monthly create meaningful scarcity. Those burning less than emission growth provide nominal holder revenue while diluting ownership.
Protocol Revenue vs. Total Fees
The relationship between total fees and protocol revenue shows fee capture efficiency. High total fees with low protocol revenue indicate most value goes to liquidity providers or other participants rather than the protocol.
DEXs typically keep 10-30% of total fees as protocol revenue, distributing the rest to liquidity providers. Derivatives platforms often capture 50-90% as protocol revenue since they don't need liquidity provider incentives.
Higher protocol revenue capture enables greater holder distributions but may reduce competitiveness. Protocols retaining too much revenue risk losing liquidity providers and users to platforms offering better terms.
Evaluate protocol revenue percentage against category norms. A DEX keeping 40% of fees may struggle to attract liquidity while a derivatives platform keeping 60% remains competitive.
Governance Rights vs. Financial Returns
Some revenue-sharing tokens bundle governance rights with financial distributions while others separate these functions. Understanding the model affects voting incentives and protocol development.
Vote-escrowed tokens like veAERO and vePENDLE require locking tokens to receive fee distributions and gain voting power. This design aligns voters with long-term protocol success since they can't immediately exit after controversial governance decisions.
Staking models like GMX grant fee distributions without requiring votes on governance. Token holders may stake purely for yield while remaining disengaged from protocol direction.
Governance-first tokens like UNI historically offered voting rights without revenue sharing. Uniswap's recent fee switch activation adds financial returns to existing governance utility, combining both value propositions.
Consider whether governance participation matters to your investment thesis. Revenue-focused investors may prefer simple staking models while governance-engaged holders value vote-escrowed mechanisms.
Revenue-Sharing by Protocol Type
Different DeFi categories employ distinct revenue-sharing approaches based on business models and competitive dynamics.
DEX Revenue Sharing
Decentralized exchanges compete fiercely for liquidity and trading volume, influencing how much revenue flows to token holders versus liquidity providers.
Vote-escrowed DEXs like Aerodrome and Velodrome distribute 100% of fees to veToken holders who vote on liquidity pool emissions. This model creates "bribe markets" where protocols pay veToken holders to direct emissions toward their pools. The combination of trading fees plus bribes can generate substantial APY for voters.
Classic AMMs like Uniswap and PancakeSwap traditionally distributed most fees to liquidity providers with minimal token holder revenue. Uniswap's recent fee switch activation allocates a small percentage to UNI stakers, marking a shift toward holder alignment. PancakeSwap implemented earlier revenue sharing through CAKE buybacks and staking rewards.
Hybrid models like Raydium combine liquidity provider fees with protocol revenue sharing. These platforms balance attracting liquidity with rewarding token holders, typically distributing 20-40% to token holders and 60-80% to liquidity providers.
DEX revenue sharing effectiveness depends on trading volume sustainability. Meme coin seasons generate temporary spikes in trading fees that may not persist. Evaluating 90-day fee trends versus 30-day snapshots reveals sustainability.
Derivatives Platform Revenue
Perpetual and options platforms generate higher fees than spot DEXs due to leverage and funding rates, enabling substantial holder distributions.
Hyperliquid's 90.9% fee distribution to HYPE holders through buybacks creates the industry's largest holder revenue stream at $62.6M monthly. The protocol's order book model and competitive trading fees attract institutional traders, generating sustainable volume.
GMX distributes 27% of fees to staked GMX holders while allocating the majority to GLP liquidity providers who serve as the counterparty to traders. This split reflects the protocol's novel liquidity model where LPs essentially act as the house.
dYdX sends 100% of staking rewards funded by trading fees to DYDX stakers securing the Cosmos-based chain. The protocol's transition to an application-specific blockchain enabled this direct revenue sharing model.
Derivatives revenue sustainability correlates with market volatility and trading activity. Bull markets generate higher perpetual trading volumes while bear markets reduce fees. Assessing holder revenue across market cycles reveals baseline sustainable levels.
Lending Protocol Revenue
Lending platforms earn interest spreads between borrower rates and lender returns, typically retaining significant reserves before distributing to token holders.
Aave allocates 5.5% of protocol fees to AAVE stakers through the Safety Module. Stakers provide insurance against protocol shortfalls, earning rewards for taking on this risk. The low distribution percentage reflects Aave's priority on building treasury reserves.
Compound historically retained all interest spreads for protocol reserves without COMP token distributions. This treasury-first approach prioritizes long-term sustainability over immediate holder returns.
Alternative lending protocols like Maple and TrueFi experiment with higher holder revenue percentages to compete for users. These platforms may distribute 30-50% of fees to token holders while maintaining adequate reserves.
Lending protocol revenue sharing often ties to risk-taking mechanisms. Platforms distributing higher percentages typically require token staking as insurance, aligning rewards with protocol security provision.
Launchpad Revenue
Token launch platforms capture value from new project listings and token creation fees, with varying distribution models.
pump.fun's $43.8M monthly holder revenue comes from fees charged for meme token launches and liquidity provision. The platform's simple model charges per token creation and takes a percentage of trading fees, distributing most revenue directly to token holders.
Launchpad revenue tends to be highly cyclical, surging during meme coin seasons and declining in quieter markets. The 30-day snapshot may not represent sustainable baseline revenue.
Infrastructure Protocol Revenue
Infrastructure protocols like Helium and Thorchain provide network services with revenue models tied to usage metrics.
Helium distributes 100% of data transfer fees to HNT stakers securing the decentralized wireless network. As IoT adoption grows, network usage and fee revenue increase proportionally. The model creates direct alignment between network utility and token holder returns.
Thorchain generates revenue from cross-chain swap fees and distributes to RUNE node operators. The protocol's security model requires significant RUNE bonding, making node operation competitive and tying distributions to security provision.
Infrastructure revenue depends on real-world adoption of decentralized networks. These protocols offer potentially high growth but face longer timelines than purely financial DeFi protocols.
Comparing Revenue-Sharing to Staking Rewards
Many investors confuse revenue-sharing distributions with inflationary staking rewards. Understanding the difference prevents misallocating capital to unsustainable yield.
Inflationary staking generates rewards by minting new tokens according to an emission schedule. The protocol pays stakers by increasing total supply, diluting non-stakers. Annual percentage yields often appear high (10-50% APY) but come from monetary inflation rather than revenue.
Calculating real returns requires subtracting inflation rate from nominal APY. A token offering 20% staking APY with 15% annual inflation provides only 5% real yield. If the inflation exceeds APY, stakers still lose purchasing power.
Revenue-funded staking pays rewards from protocol fee income rather than new token issuance. Helium's HNT staking distributes actual network usage fees, creating positive-sum returns rather than zero-sum redistribution. Real yield equals nominal APY since no dilution occurs.
Compare emission schedules against fee revenue to identify which model applies. If annual emissions exceed total fee revenue, staking remains primarily inflationary. If fee revenue exceeds or matches emissions used for staking rewards, the model provides real yield.
Many protocols blend both approaches, using emission schedules to supplement fee revenue during growth phases. Evaluate whether the roadmap includes reducing emissions as fee revenue grows, indicating progression toward sustainable revenue sharing.
Token price appreciation potential differs significantly between models. Inflationary staking creates constant selling pressure as stakers claim and sell rewards. Revenue-funded distributions come from external fee payments, avoiding this pressure.
Case Study: Hyperliquid's Revenue-Sharing Model
Hyperliquid's $62.6M monthly holder revenue demonstrates how high-volume derivatives platforms create substantial token holder value through buyback mechanisms.
The protocol operates a fully on-chain order book for perpetual trading, competing with centralized exchanges through low fees and high performance. Trading volume averages $3-4 billion daily, generating significant fee revenue.
Hyperliquid allocates 90.9% of all trading fees to systematic HYPE token buybacks. The protocol's validators execute these buybacks continuously as fees accumulate, creating constant market buying pressure. Purchased tokens burn permanently, reducing total supply.
The buyback percentage exceeds most competitors, with only vote-escrowed DEXs like Aerodrome distributing higher percentages. This aggressive holder revenue sharing attracted significant attention during HYPE's launch.
Token supply dynamics show the buyback impact. If Hyperliquid maintains current trading volume, annual buybacks would total approximately $751M. Compared to total fully diluted valuation, this creates meaningful supply reduction and price support.
The model faces risks from competitive pressure and regulatory uncertainty. Zero-fee derivatives platforms emerging in 2026 could reduce Hyperliquid's market share and fee generation. Changes to HYPE's legal classification might require modifying the buyback program.
Holder revenue sustainability depends on maintaining trading volume. Bull market conditions driving current high volumes may not persist indefinitely. Evaluating fee revenue during different market conditions provides better baseline expectations.
Case Study: Aerodrome's veToken Model
Aerodrome's 100% fee distribution to veAERO holders represents the most holder-aligned model among major DEXs, demonstrating how vote-escrowed mechanisms maximize revenue sharing.
The protocol processed over $177 billion in trading volume during 2025, becoming Base network's dominant liquidity venue. This volume generates substantial trading fees that flow entirely to veAERO voters.
Users lock AERO tokens for 1-4 years to receive veAERO NFT positions granting voting power and fee claims. Each weekly epoch, veAERO holders vote on directing AERO emissions toward specific liquidity pools. In return, they receive 100% of trading fees from the previous week plus any incentives (bribes) protocols pay for votes.
The bribe market creates a compounding effect. DeFi protocols competing for liquidity on Base pay AERO holders to vote for their pools, adding to base trading fee distributions. During active periods, bribe income can exceed trading fees.
Lock duration affects both voting power and distribution amounts. Maximum 4-year locks provide the highest voting power per AERO token, capturing more fees per token locked. Shorter locks receive proportionally less.
The model succeeds on Base network due to limited competition and ecosystem growth. Base's user activity increased significantly through 2025-2026, driving Aerodrome volume higher. This network effect benefits early veAERO lockers as new protocols launch on Base and need liquidity.
Risks include competition from other Base DEXs and potential Base network growth slowdown. If competing DEXs capture market share, Aerodrome's trading volume and fee generation would decline proportionally.
The MetaDEX03 upgrade targets 3x voter earnings through improved efficiency and integrations. If successful, veAERO holder revenue could reach $20M+ monthly, making it the second-highest revenue-sharing token after Hyperliquid.
Future of Revenue-Sharing Tokenomics
Revenue-sharing models continue evolving as protocols experiment with holder alignment while maintaining competitiveness and regulatory compliance.
Regulatory pressure increasingly questions whether revenue-sharing tokens constitute securities under traditional frameworks. The SEC's stance on crypto dividends remains uncertain, creating risk for protocols implementing direct distributions. This uncertainty drives many projects toward buyback models that provide holder value without explicit dividend payments.
Real yield narratives gained prominence as investors demand sustainable returns beyond inflationary emissions. Protocols demonstrating genuine fee revenue and holder distributions attract more institutional capital than those relying on liquidity mining and emissions.
Competitive dynamics push protocols to increase holder revenue percentages to attract token buyers. This trend benefits investors but may leave some protocols underfunded for development. The balance between holder distributions and treasury accumulation affects long-term sustainability.
Layer 2 expansion creates opportunities for new revenue-sharing models on chains like Base, Arbitrum, and Optimism. Lower transaction costs enable higher-frequency trading and more complex distribution mechanisms. Aerodrome's success on Base demonstrates how chain-specific network effects create dominant positions.
Cross-chain revenue aggregation may emerge as protocols operating on multiple chains consolidate fee revenue. Unified distribution mechanisms across chains could simplify holder revenue tracking and increase total distributions.
Governance evolution will likely separate financial returns from voting rights for some protocols as they mature. The current trend bundles both functions, but specialized governance tokens and separate yield tokens may emerge to optimize each purpose.
Token holder activism around revenue sharing will probably increase as the industry matures. Holders of governance tokens generating substantial fees without distributions may push for fee switches and buyback programs. Uniswap's recent activation demonstrates this pressure.
Key Takeaways
The top 15 revenue-sharing protocols distributed $147.8M to token holders over 30 days, led by Hyperliquid's $62.6M in buyback-funded holder revenue.
Holder revenue represents protocol fees distributed to token holders through staking rewards, buybacks, burns, or direct payments - distinct from inflationary staking rewards.
Distribution mechanisms include direct fee sharing, buyback and burn programs, fee burns, and revenue-funded staking, each with different tax implications.
Derivatives platforms generate the highest holder revenue at $76.6M monthly across 19 protocols, followed by launchpads at $48M and DEXs at $20.5M.
Evaluating sustainable holder revenue requires analyzing fee sustainability, distribution percentages, token supply dynamics, and protocol revenue capture rates.
Revenue-sharing percentages range from 4-100% of total fees, with protocols like Aerodrome and Velodrome distributing everything to token holders while Aave and Uniswap retain most for treasuries.
Buyback and burn mechanisms like Hyperliquid's avoid creating taxable events for holders while direct distributions from platforms like Aerodrome typically trigger tax obligations.
Conclusion
Revenue-sharing tokenomics represent a fundamental shift from governance-only tokens toward business models that align protocol success with token holder returns. The data reveals substantial variation in holder revenue generation, with top protocols distributing over $60M monthly while others provide minimal returns.
Sustainable crypto dividends require genuine fee revenue from protocol usage rather than temporary incentives or inflationary emissions. Hyperliquid's $62.6M in monthly buybacks stems from high perpetual trading volume, while Aerodrome's $6.9M distributions come from consistent DEX activity on Base network.
Investors evaluating revenue-sharing tokens should prioritize fee sustainability over absolute APY figures, understand distribution mechanism tax implications, and verify that holder revenue represents real protocol income rather than dilutive emissions. The protocols delivering consistent holder revenue across market cycles demonstrate sustainable models worth consideration.
For deeper analysis of specific protocol tokenomics, explore our detailed profiles on Uniswap tokenomics and Aave tokenomics. Track real-time holder revenue metrics through DeFiLlama's protocol dashboards to monitor changing distributions and identify emerging revenue-sharing opportunities.
FAQs
FAQ
What is the difference between crypto dividends and staking rewards?
Crypto dividends come from protocol fee revenue generated by actual users, representing real yield from business operations. Staking rewards funded by token emissions create yield through inflation, diluting non-stakers without generating external value. Revenue-funded staking combines both approaches by distributing fee income to stakers.
Which crypto token pays the highest dividends in 2026?
Hyperliquid's HYPE token leads all revenue-sharing crypto with $62.6M in monthly holder revenue through systematic buyback and burn mechanisms funded by perpetual trading fees. pump.fun's PUMP token ranks second at $43.8M monthly, followed by Jupiter's JUP at $10.5M.
Are crypto dividends taxable?
Tax treatment varies by jurisdiction and distribution mechanism. Direct distributions in tokens or stablecoins typically create ordinary income tax obligations when received. Buyback and burn mechanisms generally don't trigger immediate taxes, with holders realizing gains only when selling. Consult qualified tax professionals for jurisdiction-specific guidance.
How can I verify holder revenue data?
DeFiLlama provides standardized holder revenue tracking by parsing on-chain fee distributions, treasury buybacks, and burn transactions. Individual protocol dashboards also display revenue metrics. Compare multiple sources and verify on-chain data through block explorers for accuracy.
What percentage of fees should a protocol distribute to token holders?
Distribution percentages depend on protocol maturity and growth strategy. Established protocols with strong market positions can safely distribute 70-100% of fees to holders. Early-stage platforms typically retain 80-95% for development and treasury building. The optimal percentage balances holder returns with long-term sustainability.
About the Author
Founder of Tokenomics.com
With over 750 tokenomics models audited and a dataset of 2,500+ projects, we’ve developed the most structured and data-backed framework for tokenomics analysis in the industry.
Previously managing partner at a web3 venture fund (exit in 2021).
Since then, Andres has personally advised 80+ projects across DeFi, DePIN, RWA, and infrastructure.
