Written:
Feb 1, 2026
Learn how token vesting works, why it matters for crypto investments, and how to evaluate vesting schedules. Complete guide to cliffs, unlock mechanisms, and...

When a crypto project launches, one of the most critical yet often overlooked elements is how tokens are distributed over time. Token vesting determines when early contributors, investors, and team members can access and sell their tokens. A well-designed vesting schedule protects token holders from sudden supply shocks and aligns long-term incentives. A poorly designed one can trigger price crashes and erode community trust. This guide explains how token vesting works, why it matters, and how to evaluate vesting schedules when analyzing crypto projects.
What is Token Vesting?
Token vesting is the gradual release of cryptocurrency tokens to stakeholders over a predetermined period. Rather than distributing all tokens at once during the Token Generation Event (TGE), vesting locks tokens and releases them incrementally based on time elapsed, milestones achieved, or a combination of both.
Vesting applies primarily to:
Founders and core team members - Ensures sustained commitment to the project
Early-stage investors - Prevents immediate dumping after public launch
Advisors and consultants - Ties compensation to ongoing value delivery
Strategic partners - Aligns incentives for long-term collaboration
Community allocations and public sale participants typically receive tokens without vesting restrictions, though some projects implement shorter lockup periods even for these groups.
Why Token Vesting Matters
Vesting schedules serve three essential functions in tokenomics design:
1. Supply Management and Price Stability
When large token holders can sell immediately after TGE, sudden selling pressure often causes sharp price declines. Industry data shows that projects with weak vesting structures experience 40-60% higher price volatility in their first year. Vesting spreads selling pressure over time, allowing natural demand to absorb supply gradually.
2. Alignment of Long-Term Incentives
Without vesting, early participants can exit immediately after launch, leaving later investors and community members holding depreciating assets. Vesting ensures that those who built the project remain committed through critical growth phases. The standard four-year vesting period for teams mirrors traditional tech company equity vesting, creating accountability through extended lock-in periods.
3. Signal of Project Quality
Projects with aggressive vesting schedules signal confidence in long-term value creation. When teams lock their tokens for three to four years, they demonstrate belief that the protocol will succeed over that timeframe. Conversely, short vesting periods or high initial unlocks often indicate founders prioritizing quick exits over sustainable growth.
Types of Token Vesting
Different vesting structures serve different strategic purposes. Most projects combine multiple approaches across stakeholder groups.
Linear Vesting
Linear vesting distributes tokens in equal increments over a specified period. Tokens unlock continuously—daily, monthly, or quarterly—in predictable amounts.
Example: A team member with 100,000 tokens on a 48-month linear vesting schedule receives approximately 2,083 tokens per month.
Advantages:
Predictable unlock schedule makes supply modeling straightforward
Gradual release minimizes sudden supply shocks
Simple to implement via smart contracts
Disadvantages:
Constant selling pressure as tokens unlock regularly
No incentive structure tied to performance milestones
Linear vesting is the most common structure for team and investor allocations, used by approximately 70% of projects according to industry benchmarks.
Cliff Vesting
A cliff is a waiting period during which no tokens unlock. After the cliff expires, a significant portion vests immediately, followed by linear or graded releases.
Example: A "12-month cliff with 36-month linear vesting" means no tokens unlock for the first year. At month 12, 25% of the total allocation vests immediately, then the remaining 75% unlocks monthly over the next three years.
Advantages:
Deters early departures from the project
Retroactive vesting after cliff ensures contributors receive fair compensation
Protects against opportunistic short-term participants
Disadvantages:
Large cliff unlock can create temporary selling pressure
Contributors receive nothing if they leave before cliff completes
The one-year cliff remains the industry standard, used by 85% of projects with team vesting schedules.
Milestone-Based Vesting
Milestone-based vesting ties token releases to specific achievements: product launches, user adoption targets, revenue milestones, or governance participation.
Example: An advisor receives 25% of tokens upon product mainnet launch, 25% when the protocol reaches 10,000 active users, 25% at $1 million in protocol revenue, and 25% after 12 months of continued service.
Advantages:
Directly ties token distribution to value creation
Flexible structure accommodates different contributor types
Reduces risk of paying for undelivered work
Disadvantages:
Complex to implement and monitor
Milestone definitions can become contentious
Less predictable for supply planning
Milestone-based vesting is common for advisors and strategic partners but rare for team and investor allocations due to implementation complexity.
Hybrid Vesting
Most sophisticated projects combine time-based and milestone-based elements. A typical hybrid structure includes a cliff, linear vesting, and acceleration clauses tied to specific achievements.
Example: Core team tokens vest over four years with a one-year cliff (time-based), but accelerate by six months if the protocol achieves $100 million in total value locked (milestone-based).
Vesting Curve Types
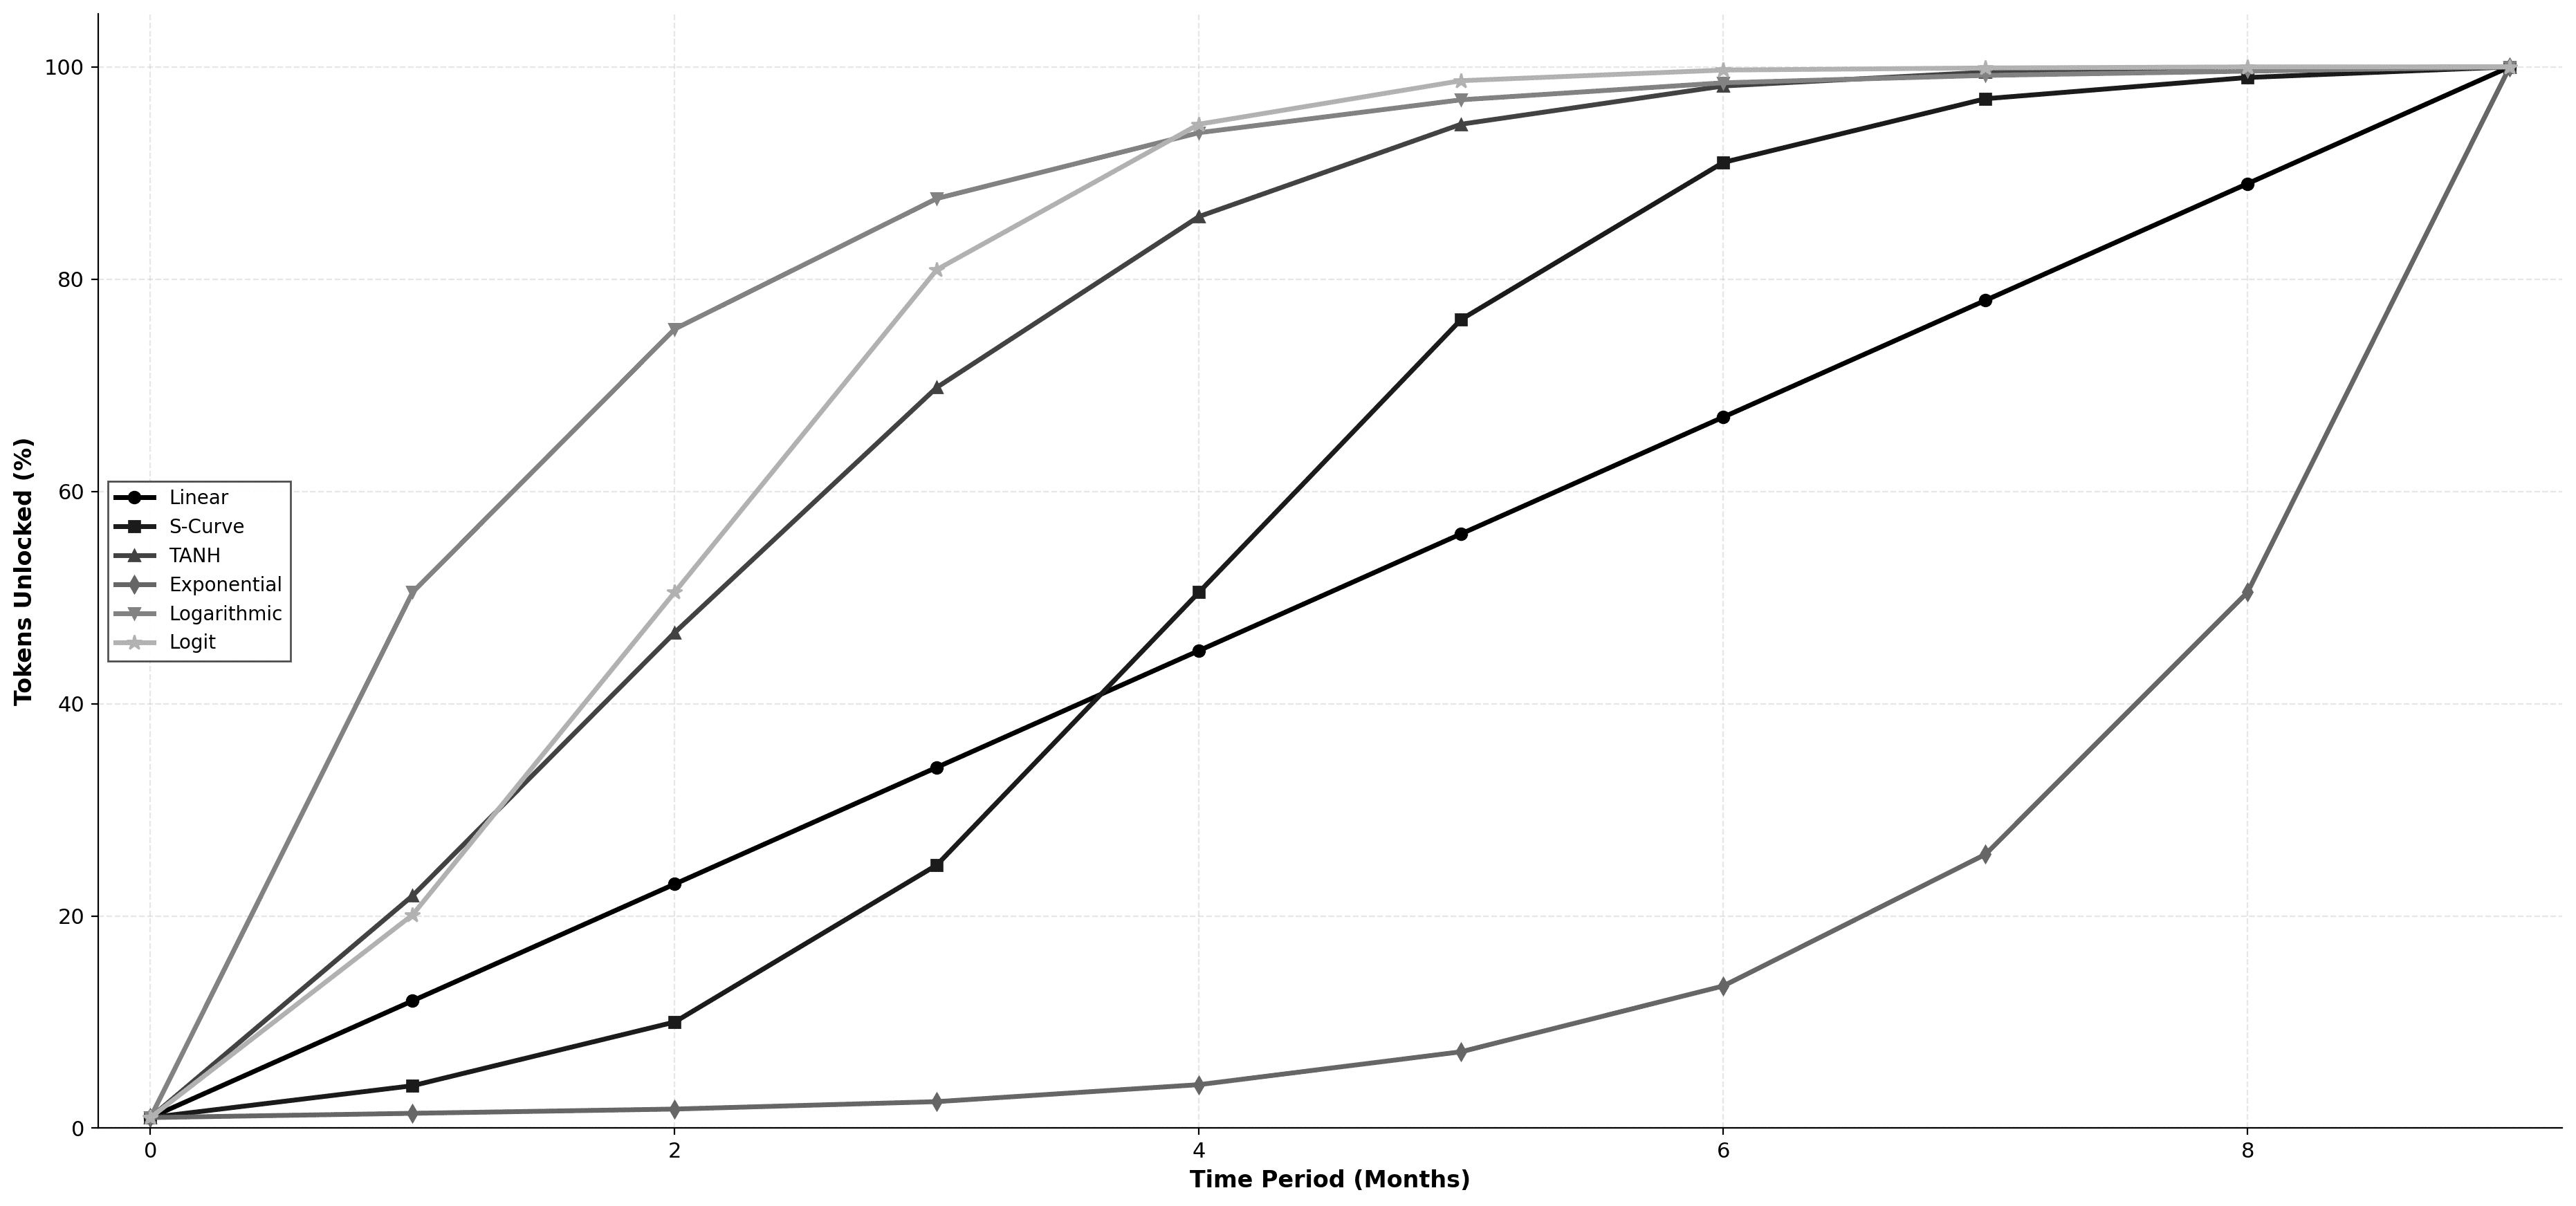
Beyond basic linear and cliff structures, projects can implement different mathematical curves that control the rate of token unlocks over time. Each curve creates distinct supply dynamics and incentive structures.
Linear Curve
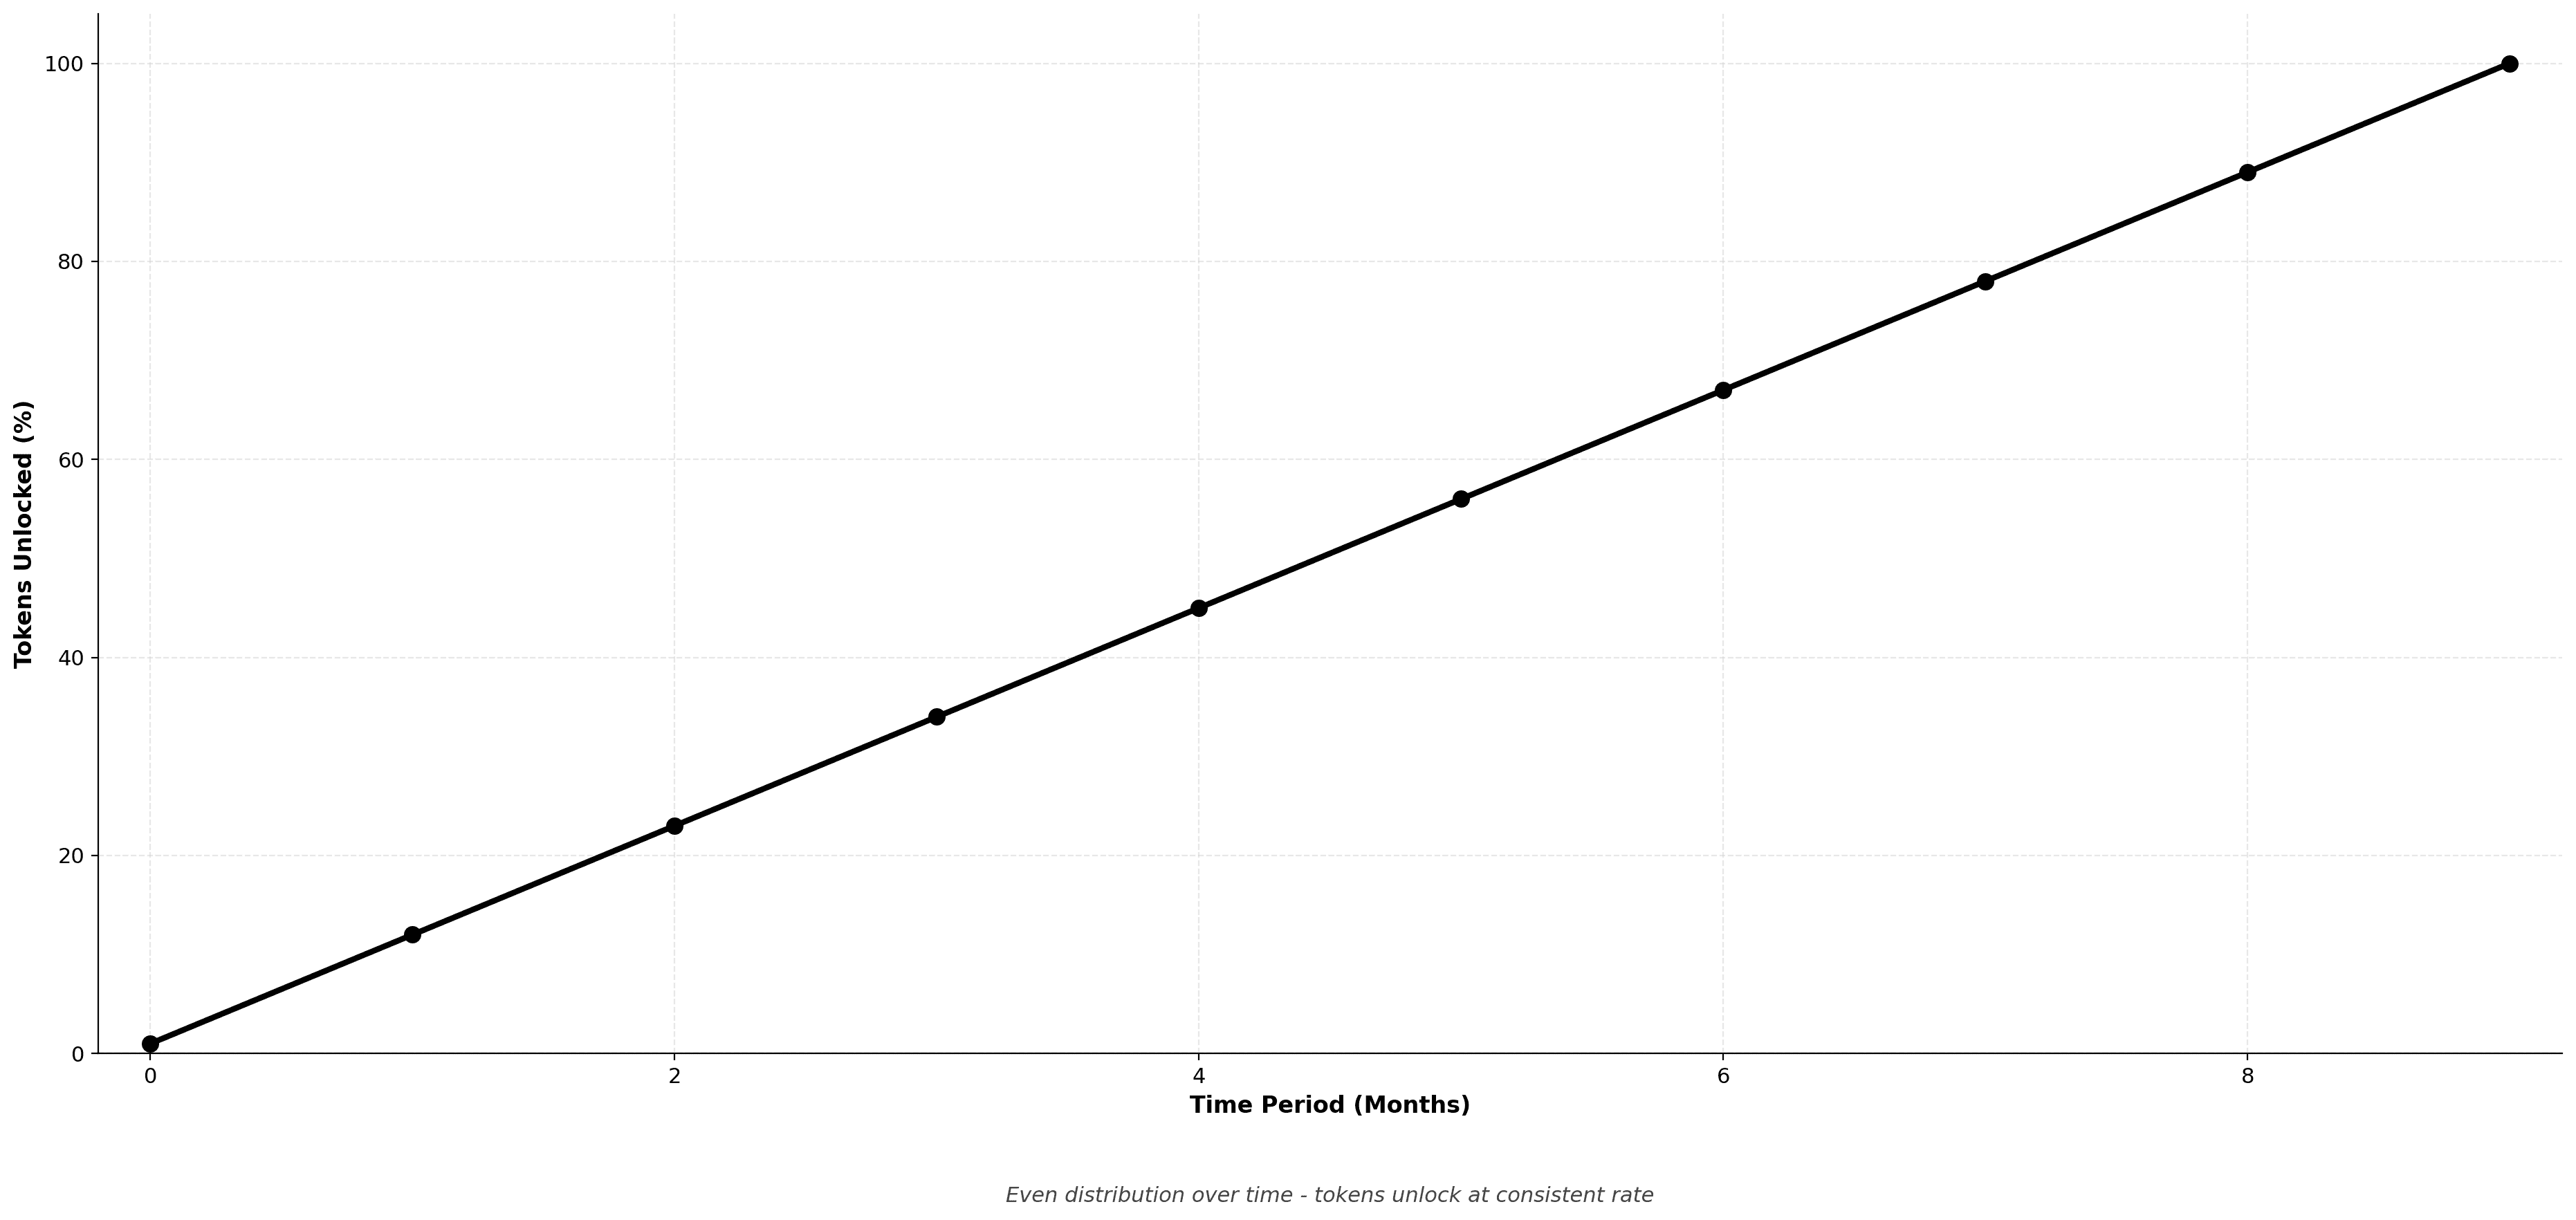
The baseline approach where tokens unlock at a constant rate throughout the vesting period. Each time interval releases the same percentage of total allocation.
Best for: Standard team and investor vesting where predictability is prioritized. Creates consistent, manageable selling pressure.
Strategic use: Default choice for most allocations due to simplicity and fairness. No participant gains timing advantages.
S-Curve (Sigmoid)
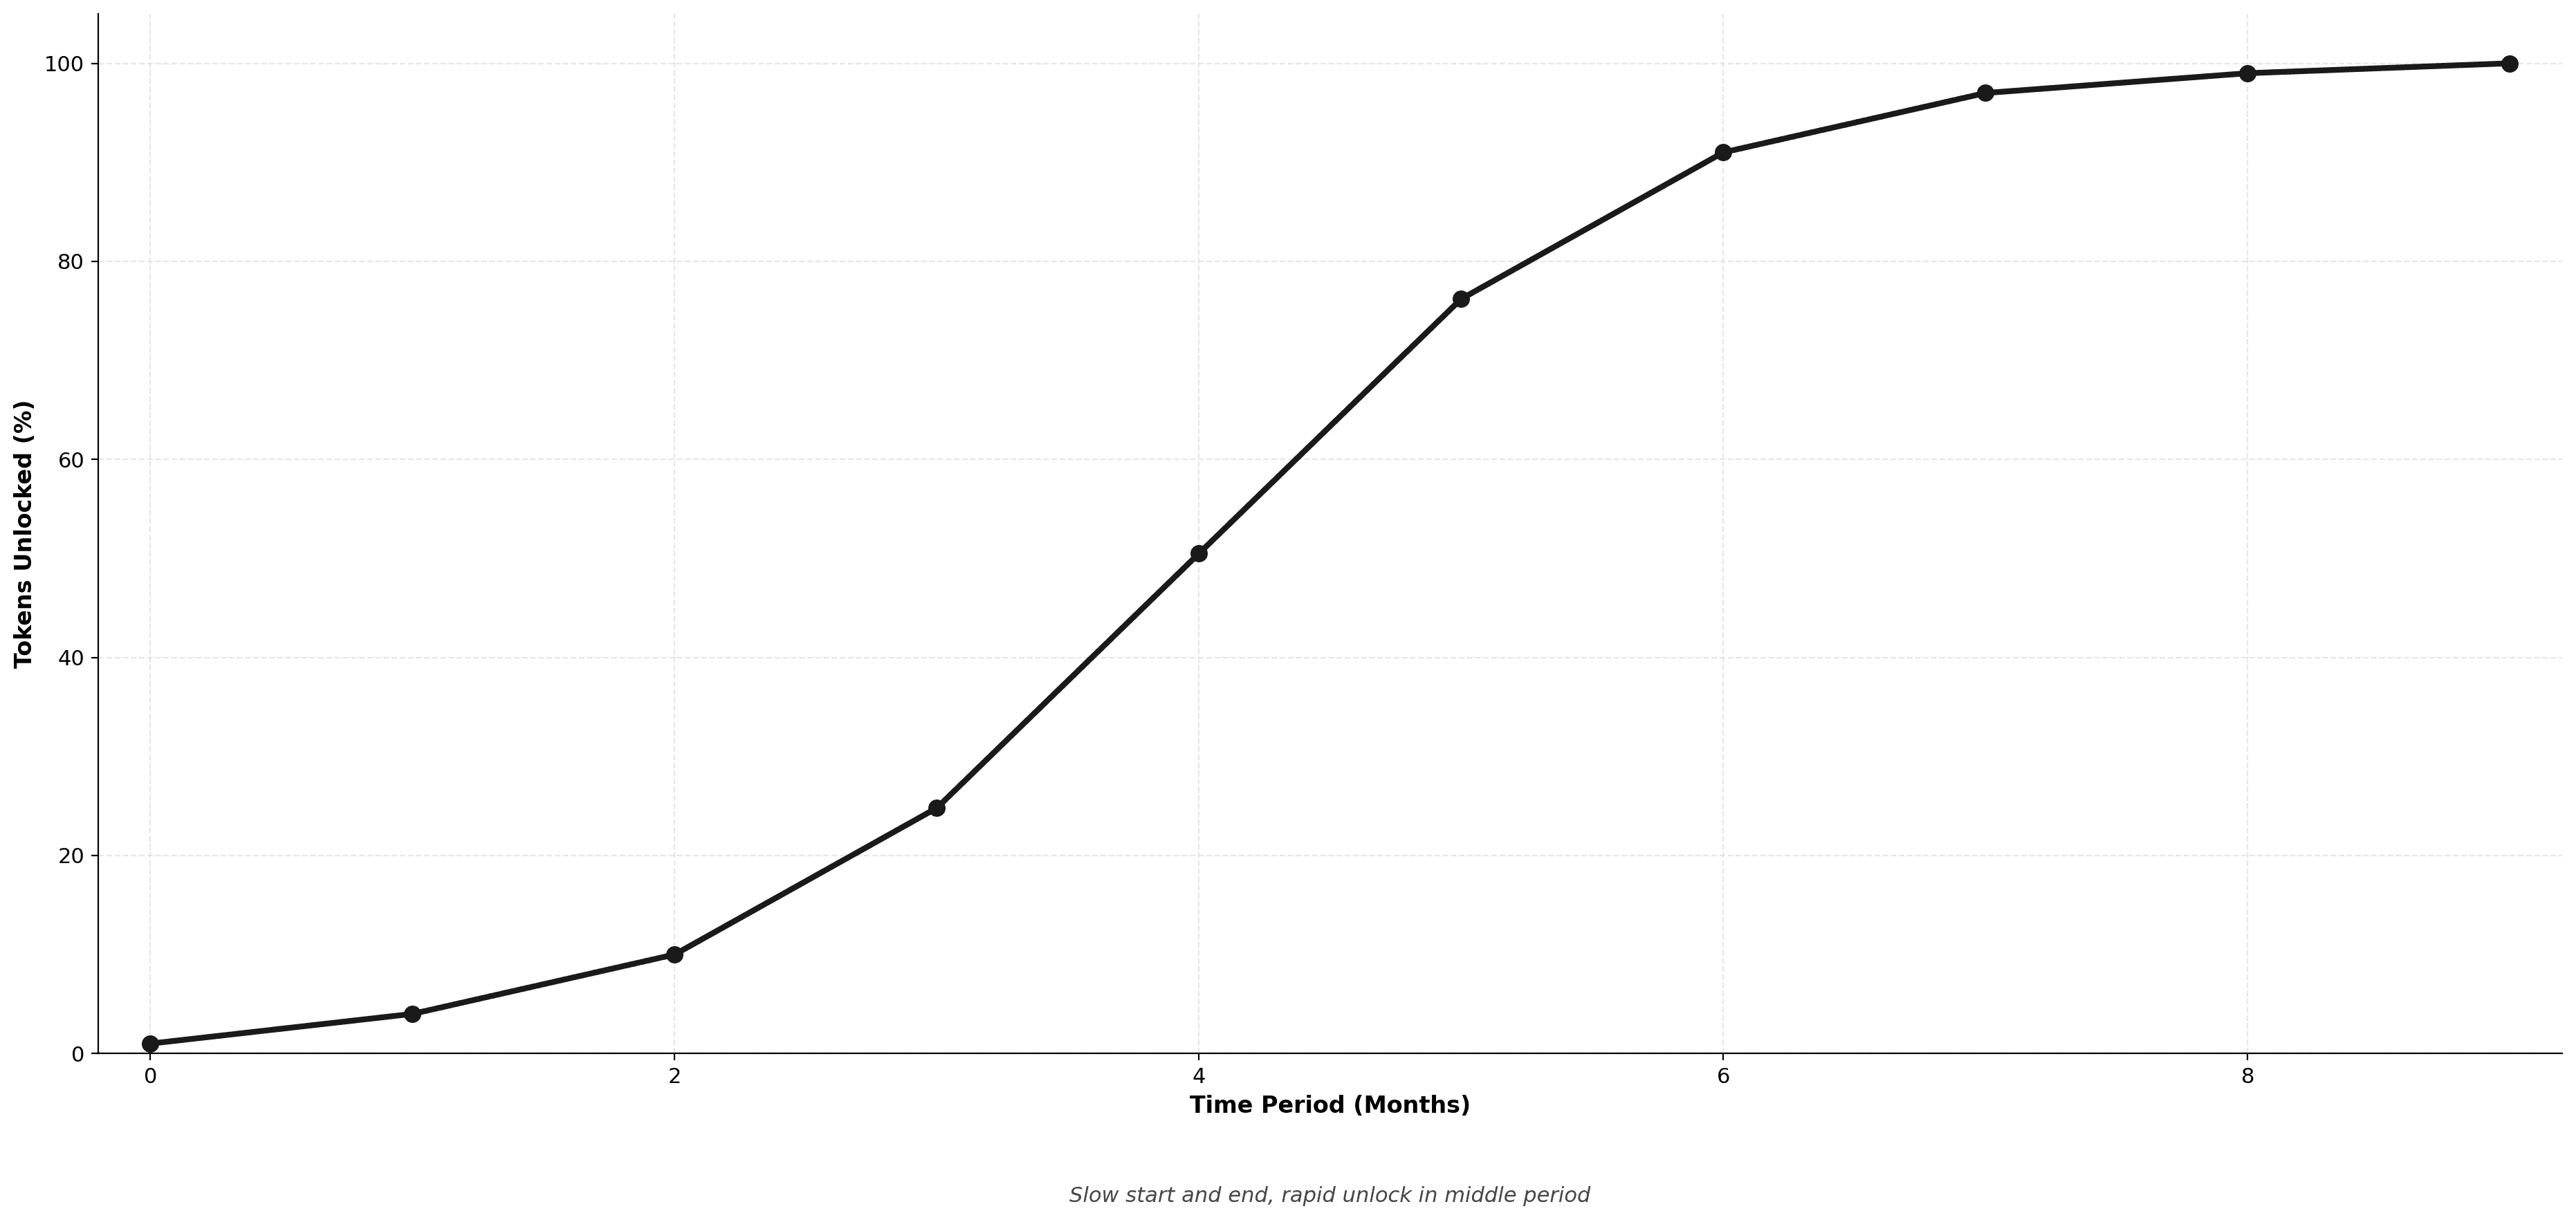
Slow initial unlock rate that accelerates through the middle period before decelerating toward the end. Creates a smooth transition through three distinct phases.
Best for: Projects prioritizing long-term holder retention. The slow start discourages early exits while the rapid middle phase rewards patience.
Strategic use: Advisors and strategic partners where commitment in early stages is critical but value delivery concentrates in growth phase.
TANH (Hyperbolic Tangent)
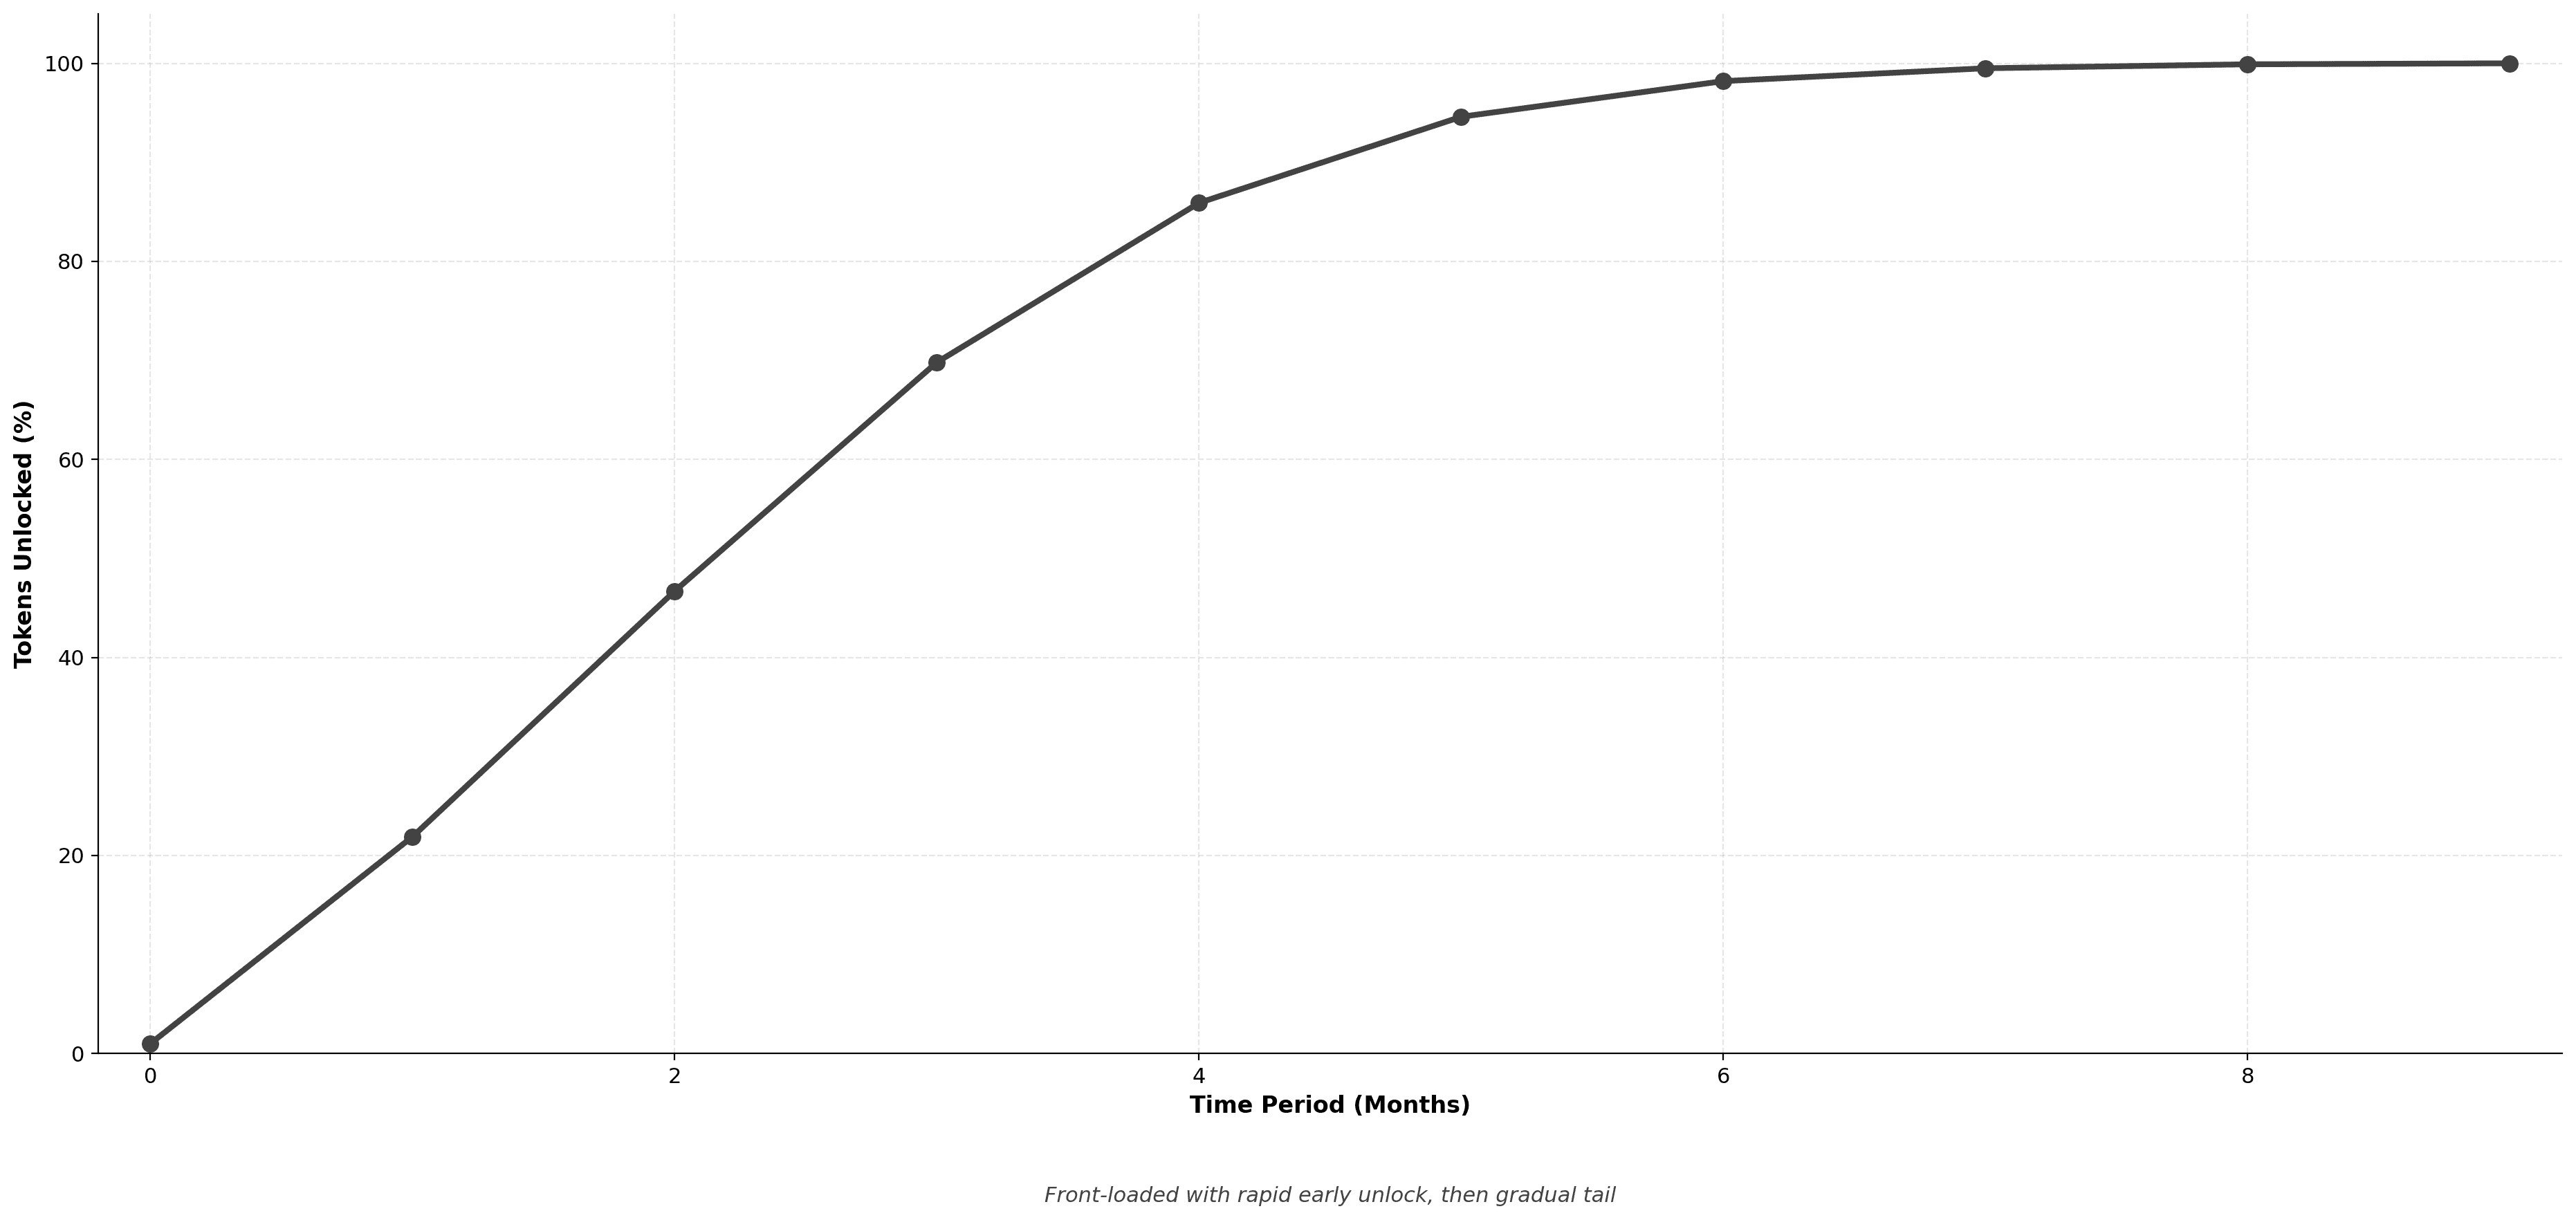
Front-loaded curve with rapid early unlocking that gradually tapers off. Majority of tokens vest in the first half of the period.
Best for: Community incentive programs where early adoption drives network effects. Rewards early participants significantly.
Strategic use: Liquidity mining programs, early contributor bonuses, or airdrop cliffs where front-loading participation rewards creates momentum.
Risk: Can create significant early selling pressure if applied to large allocations without sufficient lockup periods.
Exponential Curve
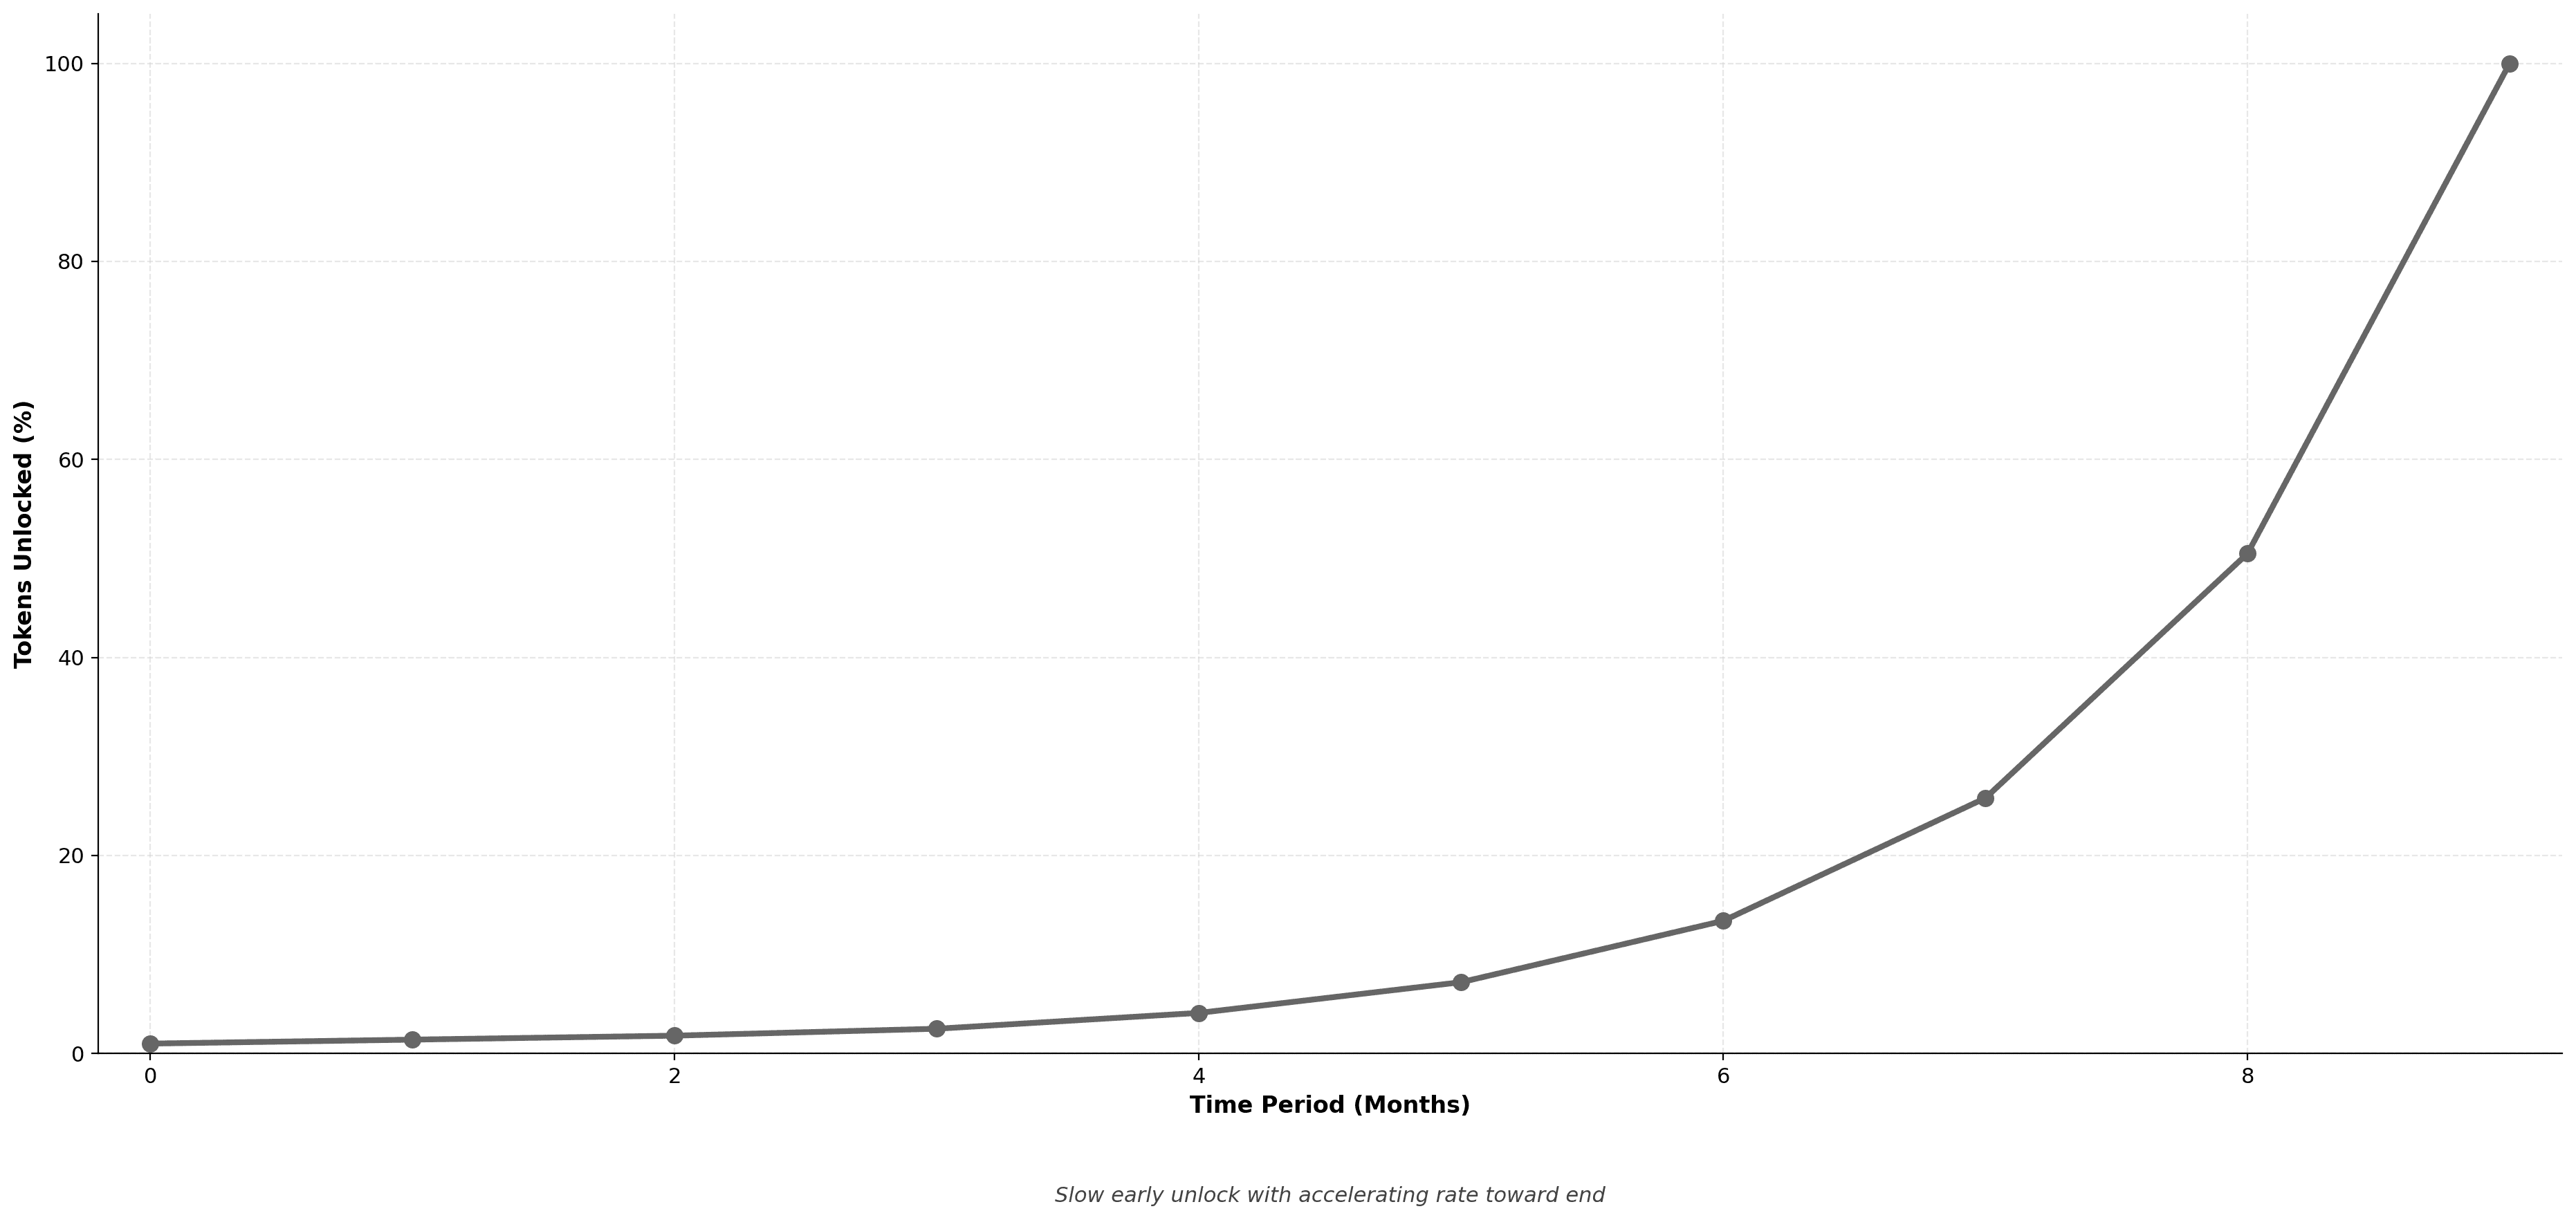
Minimal early unlocks with accelerating rate toward the end. Back-loaded structure where majority of tokens vest in final periods.
Best for: Performance-based compensation where value delivery is expected to compound over time. Aligns with exponential project growth expectations.
Strategic use: Founder allocations in projects with long development roadmaps. Creates strong incentive to remain through maturity phases when value capture accelerates.
Risk: If project fails early, contributors receive minimal compensation despite significant work. Requires strong conviction in long-term success.
Logarithmic Curve
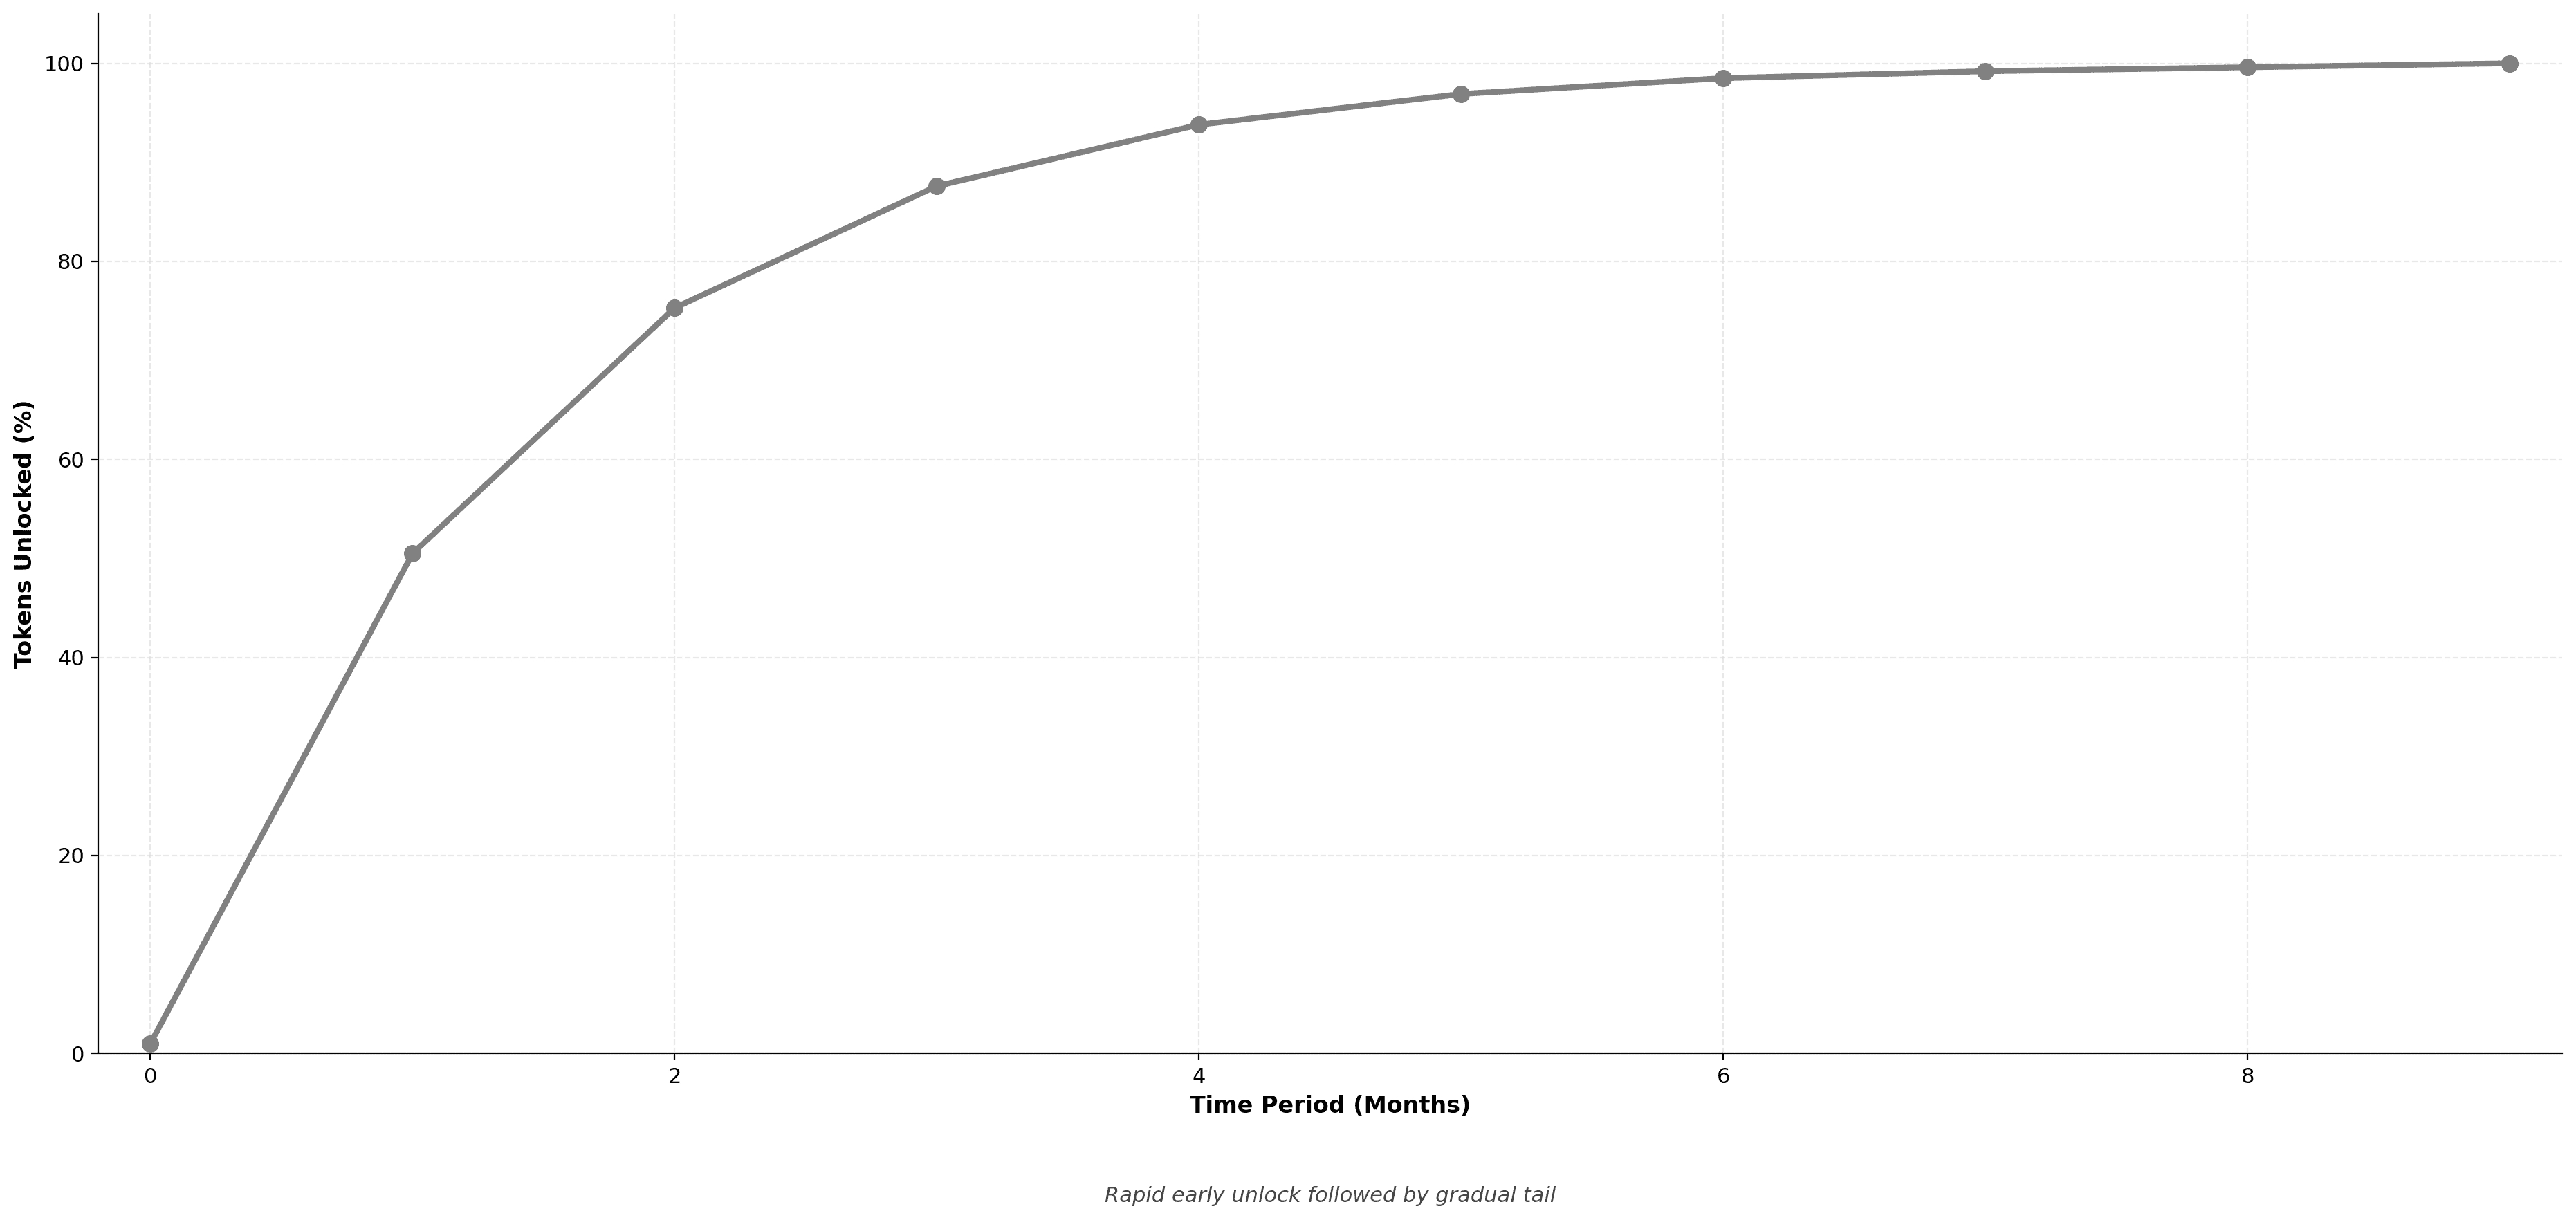
Inverse of exponential: rapid early unlocking that slows dramatically over time. Front-loads majority of allocation into initial periods.
Unlock pattern: 1% → 51% → 75% → 88% → 94% → 97% → 99% → 99% → 100% → 100%
Best for: Situations requiring immediate liquidity or compensation. Useful for consultants with concentrated early-stage contributions.
Strategic use: Emergency hiring for critical skills, one-time strategic advisors, or bridge financing where early capital access is essential.
Risk: Undermines long-term alignment. Should be used sparingly and only when immediate value delivery justifies front-loaded compensation.
Logit Curve
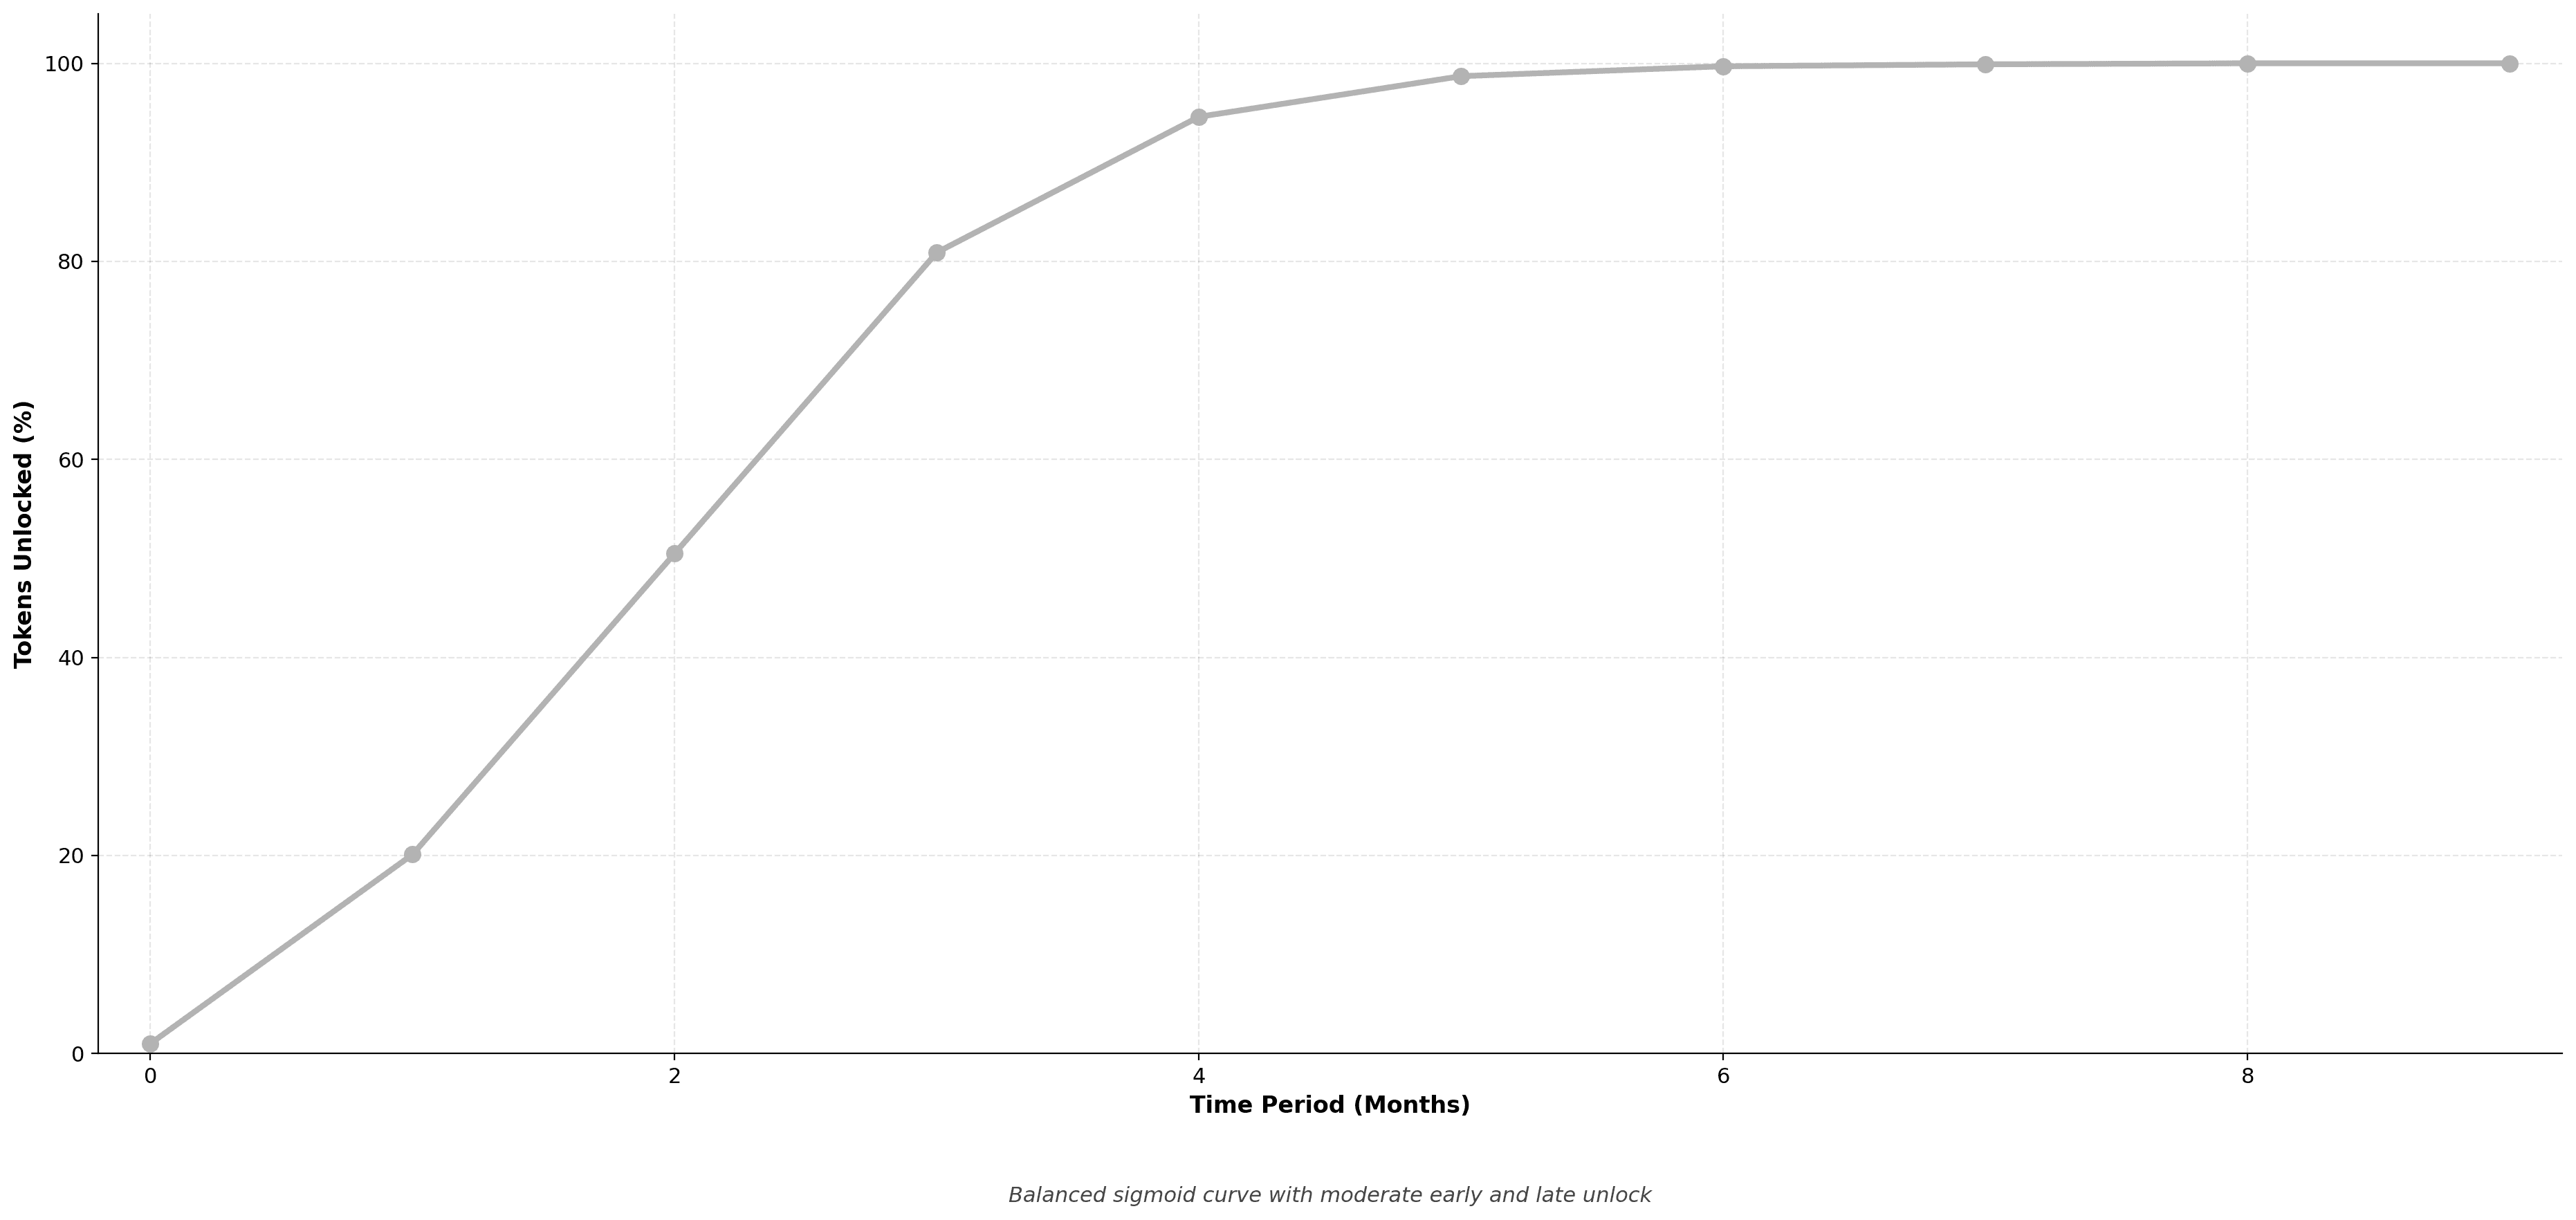
Balanced sigmoid variant with moderate early and late unlock rates. Middle 50% of vesting period sees majority of releases.
Unlock pattern: 1% → 20% → 51% → 81% → 95% → 99% → 100% → 100% → 100% → 100%
Best for: Balancing retention with reasonable liquidity access. Provides middle-ground between linear and S-curve approaches.
Strategic use: Investor allocations where some early liquidity is negotiated but long-term holding is encouraged. Creates natural sell pressure distribution without extreme concentration.
Choosing the Right Vesting Curve
The appropriate curve depends on stakeholder type and strategic objectives:
Team and founders: Linear or exponential curves align with sustained commitment. Exponential curves work well when team value delivery increases with project maturity.
Early investors: Linear or logit curves balance liquidity with retention. Avoid logarithmic curves that enable quick exits.
Strategic advisors: S-curve or TANH curves can match contribution patterns. If advice is concentrated early, TANH works; if ongoing, S-curve is better.
Community incentives: TANH or logarithmic curves drive early participation. Accept higher early selling pressure as cost of bootstrapping network effects.
Liquidity providers: Logit or S-curve for sustained participation. Early rewards prevent exit, but majority unlocks during high-activity periods.
Most projects use linear vesting as default, reserving alternative curves for specific strategic purposes. Mixing curve types across stakeholder groups can optimize for different contribution patterns while managing aggregate supply dynamics.
Key Components of Vesting Schedules
When evaluating a project's vesting structure, assess these critical elements:
Cliff Period
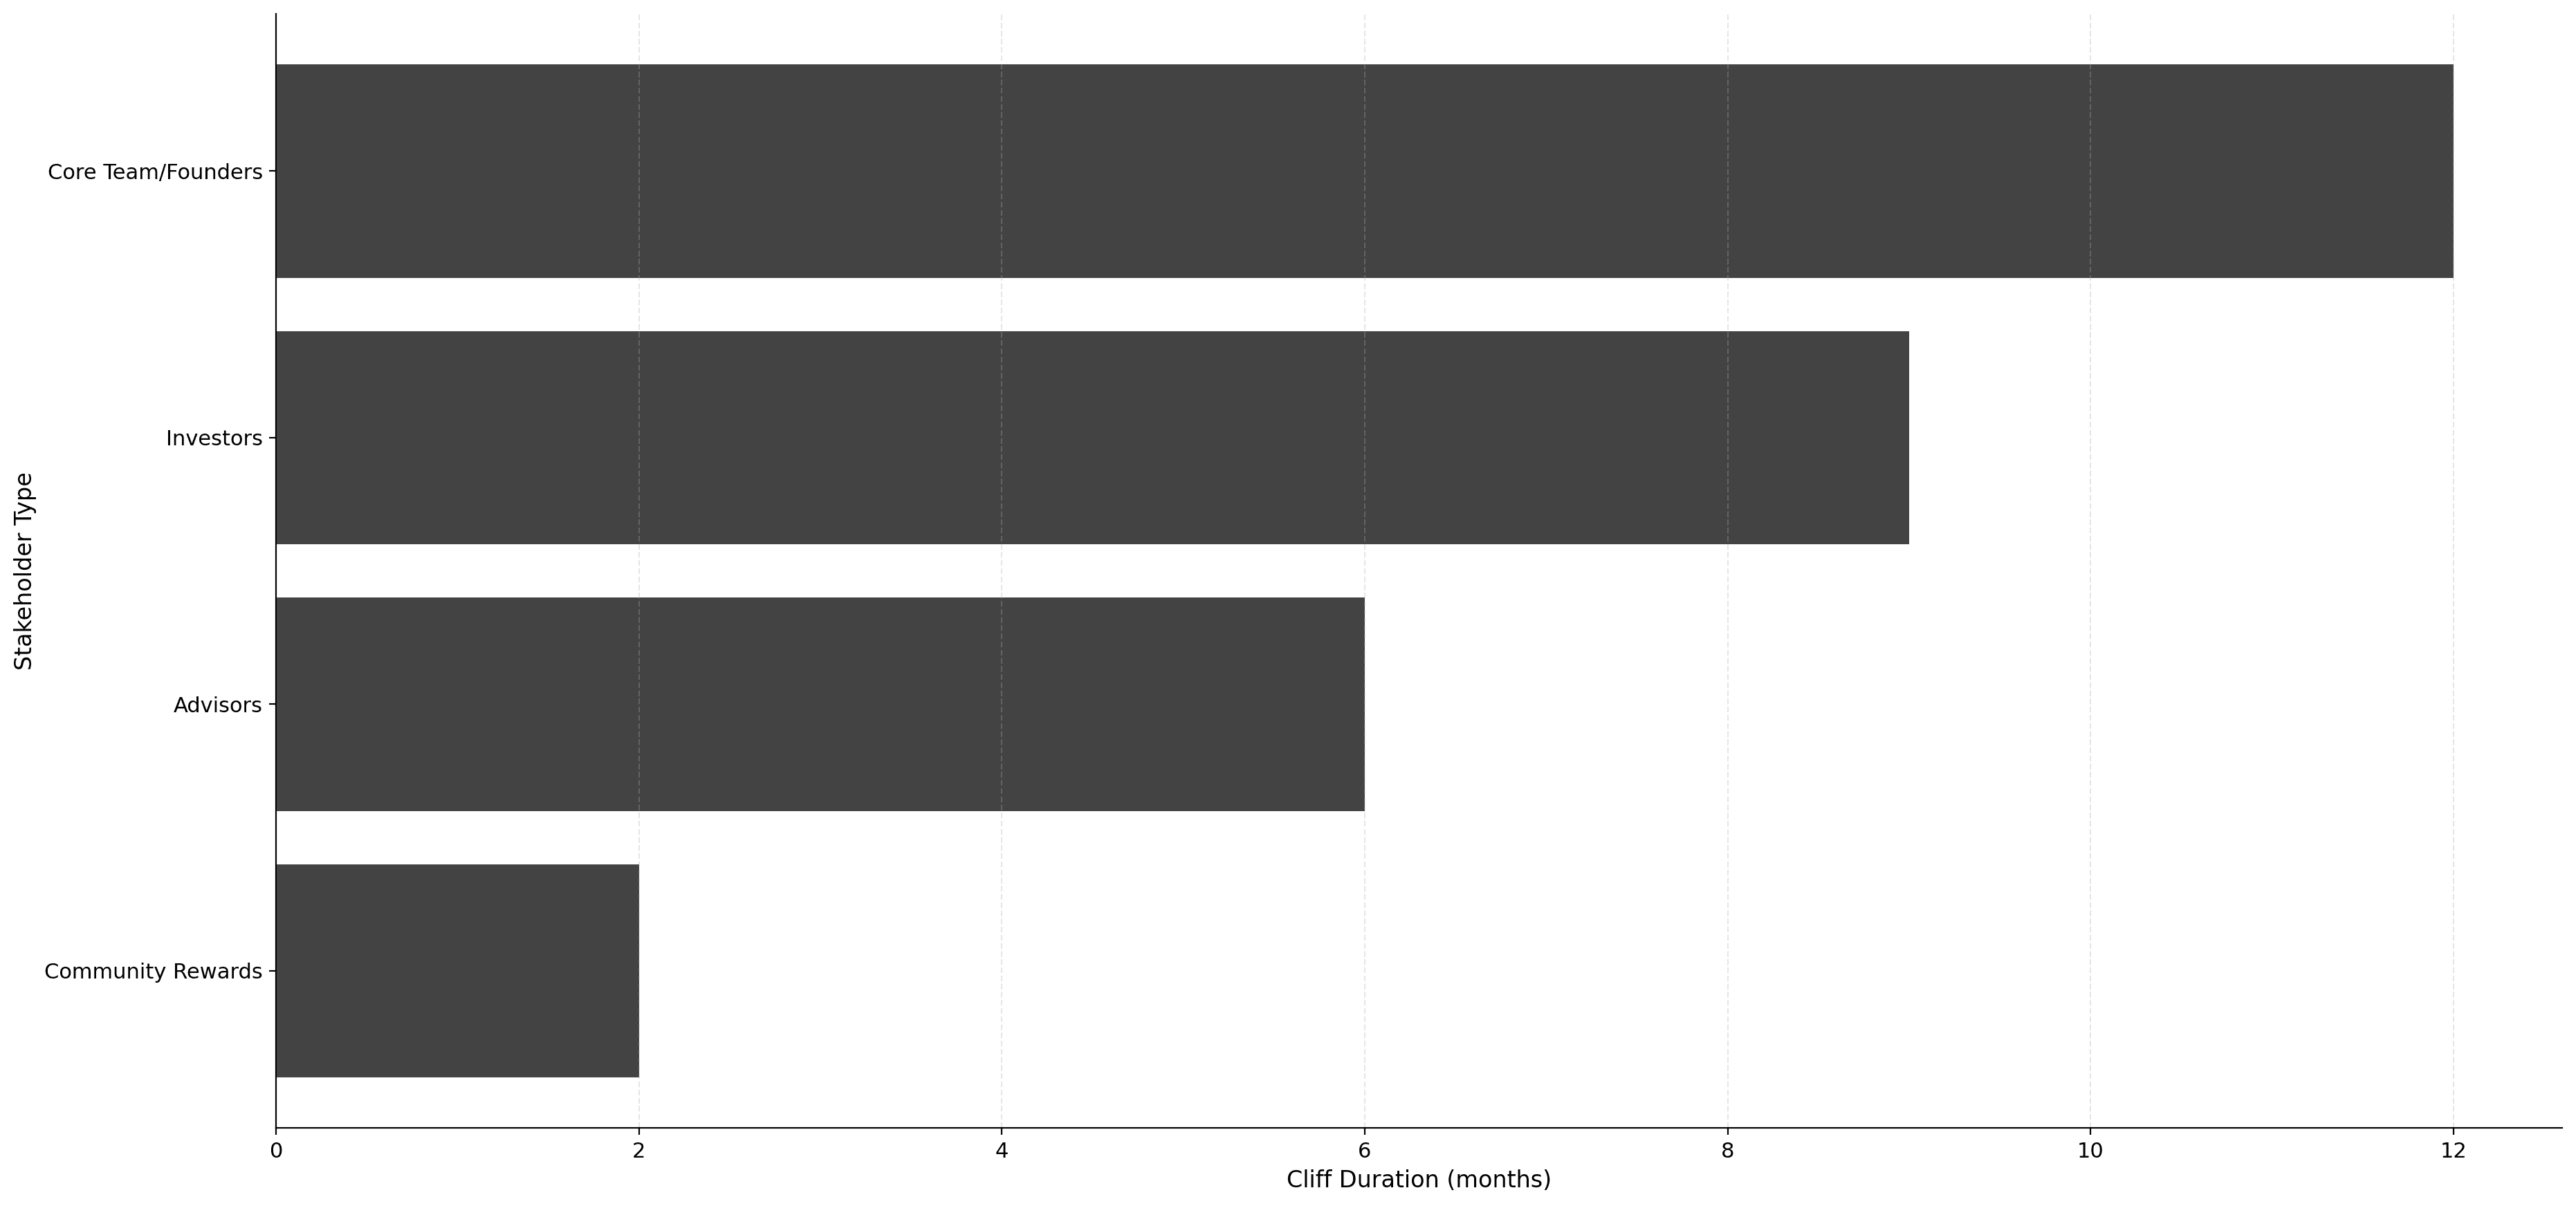
The waiting period before any tokens unlock. Industry benchmarks by stakeholder type:
Founders and core team: 12-month cliff (85% of projects)
Investors: 6-12 month cliff (70% of projects)
Advisors: 6-month cliff (typical)
Community rewards: 1-3 month cliff or none
Projects with no cliff period for team or investors raise red flags, as they allow immediate selling post-TGE.
Vesting Duration
The total period over which tokens fully unlock. Standard durations:
Core team: 3-4 years (most common is 4 years)
Investors: 2-3 years
Advisors: 12-24 months
Strategic partners: 18-36 months
Shorter vesting periods indicate higher risk of early selling pressure.
TGE Unlock Percentage
The portion of tokens that become immediately liquid at Token Generation Event. Conservative projects unlock 5-15% at TGE, with the remainder subject to vesting. Aggressive projects unlock 30-50% or more, creating immediate circulating supply pressure.
Analysis of 200+ token launches shows that projects with TGE unlocks exceeding 25% experience median first-year price declines of 72%, compared to 38% for those with sub-15% unlocks.
Vesting Frequency
How often tokens unlock after the cliff:
Daily vesting: Most granular, smoothest supply increase
Monthly vesting: Common standard, balances precision with gas efficiency
Quarterly vesting: Creates small periodic supply bumps
Annual vesting: High risk of significant selling events
Higher frequency vesting reduces concentrated unlock events but increases smart contract complexity and potential gas costs.
How to Evaluate Token Vesting Schedules
When analyzing a crypto project, assess vesting quality through this framework:
1. Allocation Distribution
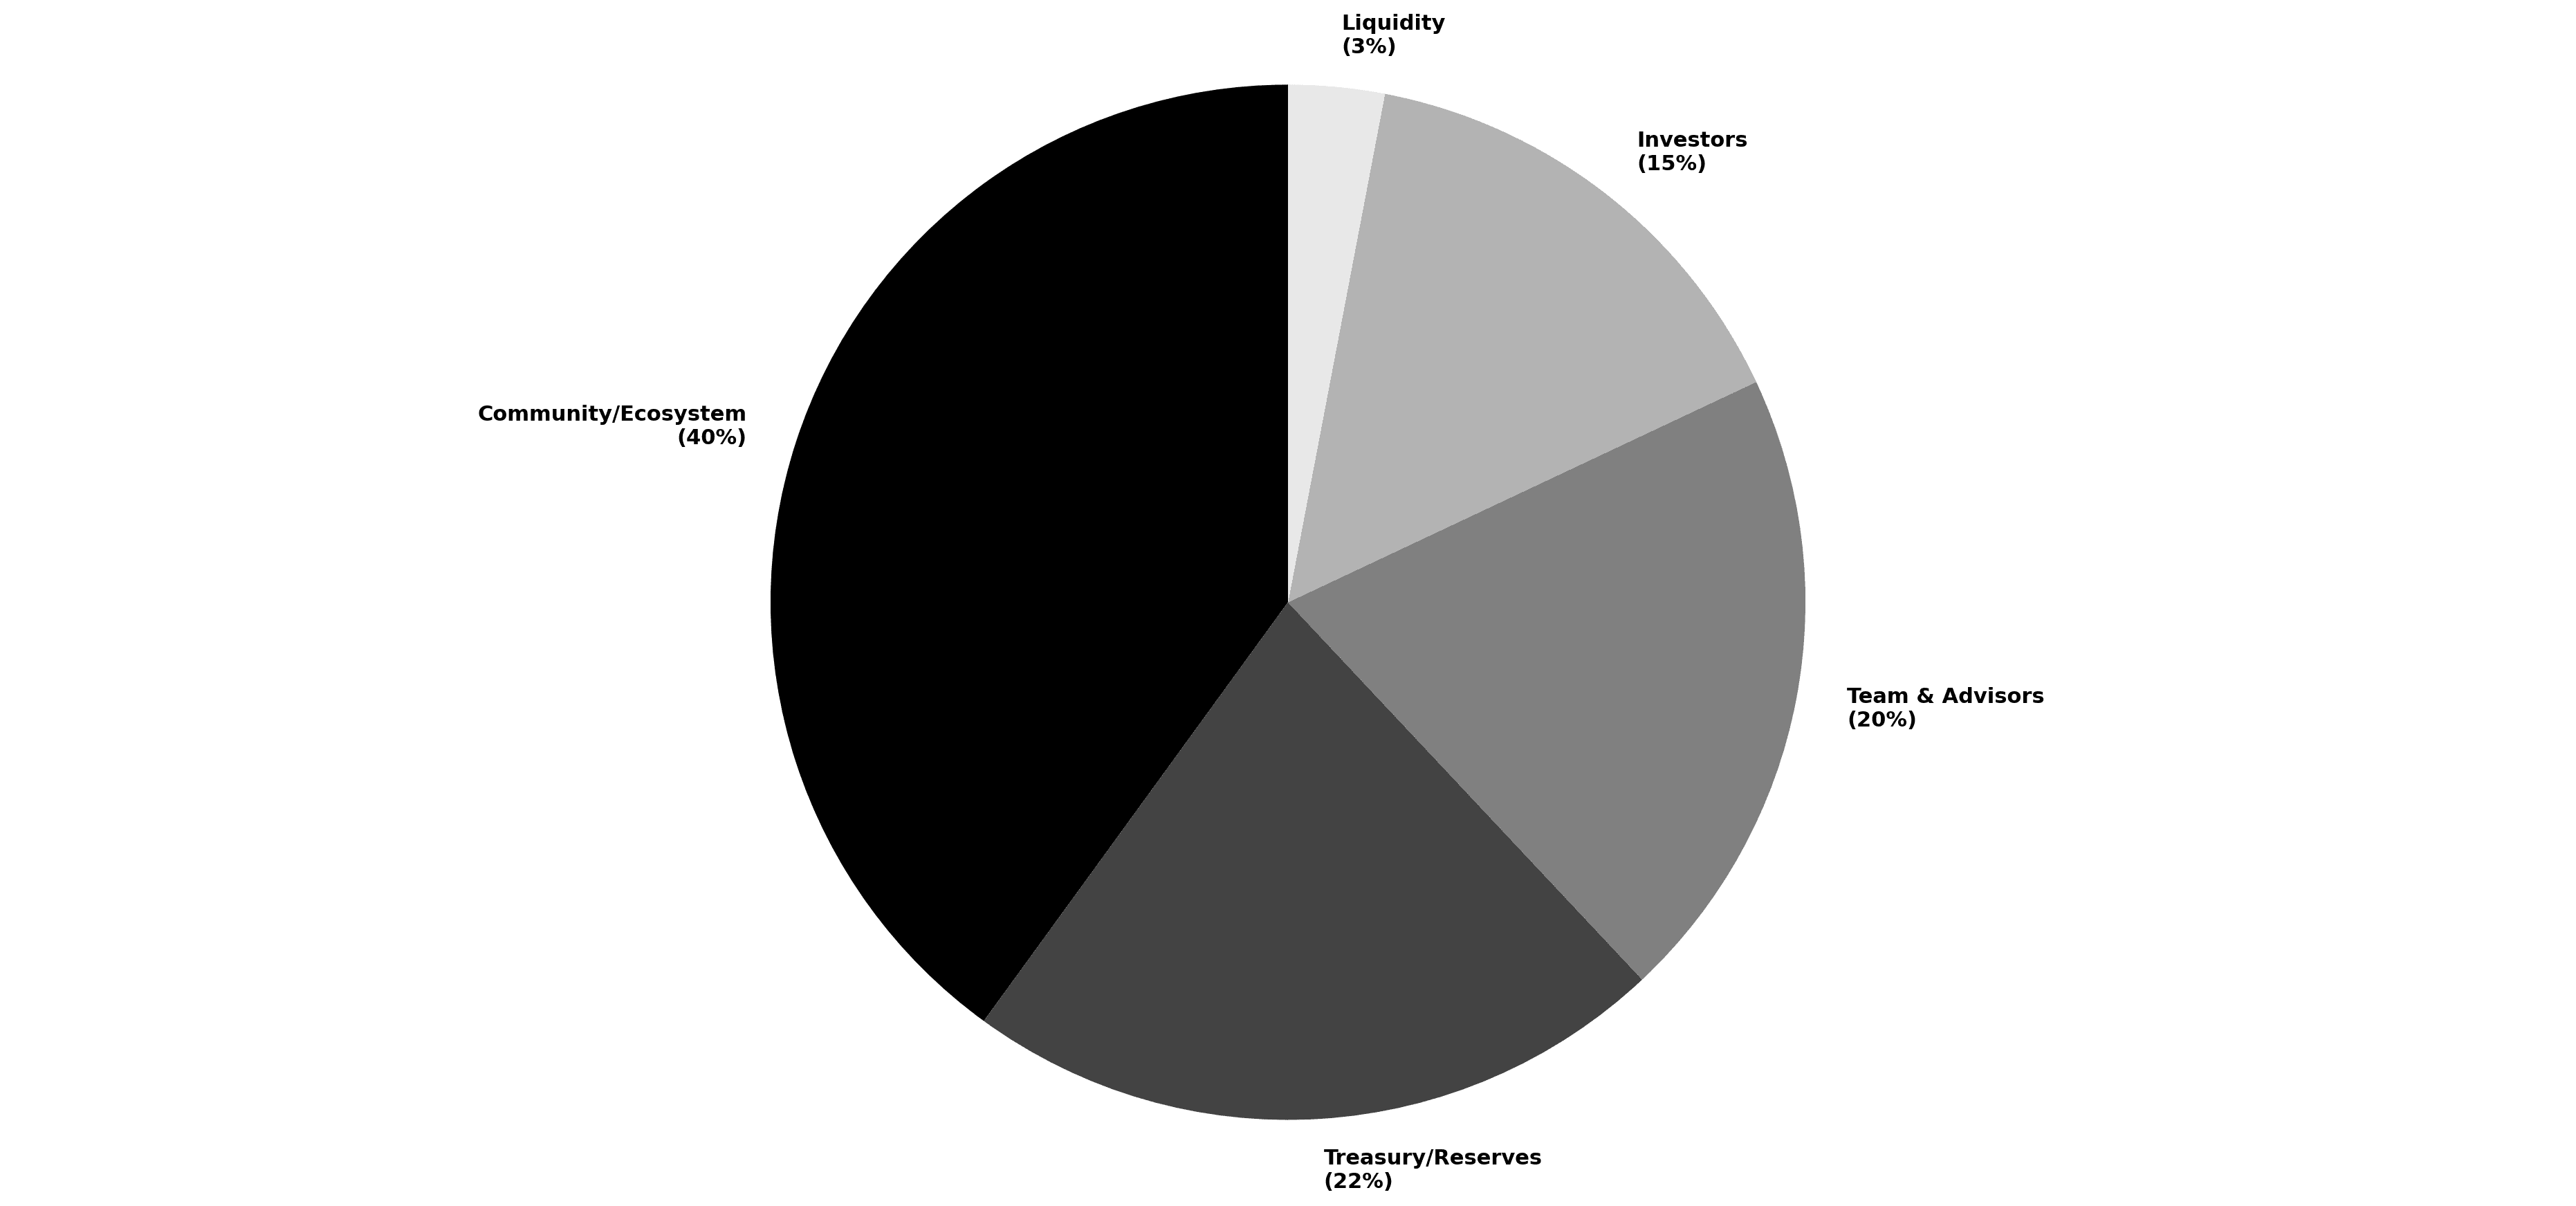
Review what percentage of total supply has vesting restrictions. Healthy distribution patterns:
Team + advisors: 15-25% of total supply
Investors: 12-20% of total supply
Community/ecosystem: 35-50% of total supply
Treasury/reserves: 15-25% of total supply
Red flags: Team allocations exceeding 30%, or investor allocations exceeding 25% with weak vesting.
2. Circulating Supply at Launch
Calculate the percentage of total supply immediately available at TGE. Projects with sub-10% initial circulating supply face higher manipulation risk and volatility. Those above 40% risk immediate selling pressure from early stakeholders.
The optimal range is 15-30% initial circulating supply, providing adequate liquidity while preserving scarcity value.
3. Unlock Event Calendar
Map all major unlock events in the first two years. Large unlocks (5%+ of circulating supply in a single month) historically correlate with 15-40% price declines in the 30 days surrounding the event.
Projects with smooth unlock curves (no single month adding more than 2-3% to circulating supply) show significantly better price stability.
4. Investor Lockup Terms
Despite allocation percentages, the critical variable is vesting structure. Investors receiving 15% of supply with no vesting pose more risk than those receiving 20% with a 12-month cliff and 36-month linear vesting.
Industry benchmarks show that 92% of projects implement lockups for investor tokens, yet only 40% extend these beyond 18 months. Projects with investor vesting periods matching or exceeding team vesting periods signal strong alignment.
5. Smart Contract Verification
Vesting schedules mean nothing without enforceable smart contracts. Verify:
Vesting contracts are deployed on-chain and publicly viewable
Code is audited by reputable firms
Contract permissions prevent admin override of vesting schedules
Unlock addresses are clearly documented
Projects claiming vesting schedules without verifiable on-chain enforcement should be treated as having no vesting at all.
Red Flags in Vesting Design
Avoid projects exhibiting these warning signs:
No cliff period for team or investors: Allows immediate dumping post-launch.
Vesting duration under 24 months for core team: Insufficient commitment timeline.
TGE unlock exceeding 30% of total supply: Creates excessive immediate selling pressure.
Asymmetric vesting (community vests longer than team): Misaligned incentives favoring insiders.
Opaque or missing smart contract implementation: Vesting schedules are promises, not guarantees.
Large unlocks concentrated in short windows: Monthly unlocks exceeding 5% of circulating supply create predictable price suppression.
No investor lockups despite fundraising: Indicates weak negotiating position or founder desperation.
Token Vesting Best Practices
For projects designing vesting schedules, follow these principles:
Match industry standards: 4-year team vesting with 1-year cliff, 2-3 year investor vesting with 6-12 month cliff. Deviating without strong justification raises concerns.
Align vesting across stakeholder groups: Team vesting should meet or exceed investor vesting. If investors lock tokens for 24 months, team vesting should be 36-48 months minimum.
Prioritize smooth unlock curves: Avoid large step-function unlocks. Prefer daily or monthly linear vesting over quarterly or annual.
Implement on-chain enforcement: Deploy audited smart contracts that make vesting schedules immutable and verifiable.
Maintain transparency: Publish clear documentation of all vesting schedules, cliff periods, and unlock calendars. Update token unlock dashboards regularly.
Build in acceleration clauses cautiously: If using milestone-based acceleration, ensure milestones are objective, measurable, and require genuine value creation (not vanity metrics).
Consider market conditions: During launches in bear markets, extend vesting periods by 6-12 months to reduce selling pressure when liquidity is limited.
Real-World Examples
Conservative vesting (aligned incentives):
Team: 20% allocation, 4-year vesting, 12-month cliff
Investors: 15% allocation, 3-year vesting, 12-month cliff
TGE unlock: 12% of total supply
First-year unlock rate: 18% of total supply
Aggressive vesting (elevated risk):
Team: 25% allocation, 2-year vesting, 6-month cliff
Investors: 22% allocation, 18-month vesting, 6-month cliff
TGE unlock: 35% of total supply
First-year unlock rate: 45% of total supply
Historical analysis shows the conservative example correlates with 2.3x better price performance over the first 24 months compared to aggressive structures.
Key Takeaways
Token vesting gradually releases tokens to stakeholders over time, preventing sudden supply shocks and aligning long-term incentives with project success.
The standard structure is a 4-year vesting period with a 1-year cliff for team members and 2-3 years with a 6-12 month cliff for investors.
Different vesting curves (linear, S-curve, TANH, exponential, logarithmic, logit) create distinct unlock patterns—linear is standard, but alternative curves can optimize for specific strategic needs.
Cliff periods deter short-term participants by requiring a waiting period before any tokens unlock, with the industry standard being 12 months for teams and 6-12 months for investors.
Evaluate vesting quality by examining allocation distribution, TGE unlock percentage, unlock event calendar, and on-chain smart contract enforcement.
Red flags include no cliff period, vesting under 24 months for core teams, TGE unlocks exceeding 30%, and missing on-chain implementation.
Projects with conservative vesting (low TGE unlock, extended vesting periods, verified smart contracts) historically outperform those with aggressive unlock schedules by 2-3x in the first two years.
Conclusion
Token vesting is one of the most important yet frequently misunderstood elements of tokenomics design. Well-structured vesting schedules protect all stakeholders by ensuring that early contributors remain committed during critical development phases while preventing destructive selling pressure. When analyzing crypto projects, always examine vesting schedules alongside allocation percentages—a seemingly fair 20% team allocation becomes problematic if it unlocks entirely in the first six months. Prioritize projects with conservative vesting structures, verified on-chain enforcement, and transparent unlock calendars. These projects signal long-term commitment and protect your investment from predictable supply shocks that plague poorly designed tokenomics.
FAQs
Tokenomics Vesting Schedule FAQ
What is a cliff in token vesting?
A cliff is a waiting period during which no tokens unlock. After the cliff expires, a portion of tokens vests immediately (typically the amount that would have vested during the cliff period), followed by regular vesting of the remaining tokens. Standard cliffs range from 6-12 months for investors and 12 months for team members.
How long should token vesting last?
Industry standards suggest 3-4 years for core team members, 2-3 years for investors, and 12-24 months for advisors. Vesting duration should align with the project's development roadmap—longer vesting periods signal confidence in sustained value creation and reduce selling pressure during critical growth phases.
Can vesting schedules be changed after launch?
This depends on smart contract implementation. Properly designed vesting contracts make schedules immutable or require multi-signature governance approval to modify. Projects that can unilaterally alter vesting terms pose significant risk, as teams could reduce their own vesting periods or accelerate unlocks without stakeholder consent.
What happens to vested tokens if a team member leaves?
This depends on the vesting agreement. Most crypto projects use "cliff forfeiture" where departing members forfeit all unvested tokens. Some projects allow partial retention based on time served. The standard tech industry model grants vested tokens permanently while forfeiting unvested portions upon departure.
How do unlock events affect token price?
Large unlock events typically create selling pressure as newly liquid tokens enter circulation. Analysis of 500+ unlock events shows median price declines of 8-15% in the 30 days surrounding unlocks exceeding 5% of circulating supply. However, strong fundamental performance and market demand can offset unlock pressure, with 30% of major unlocks showing price appreciation during the unlock period.
About the Author
Founder of Tokenomics.com
With over 750 tokenomics models audited and a dataset of 2,500+ projects, we’ve developed the most structured and data-backed framework for tokenomics analysis in the industry.
Previously managing partner at a web3 venture fund (exit in 2021).
Since then, Andres has personally advised 80+ projects across DeFi, DePIN, RWA, and infrastructure.
